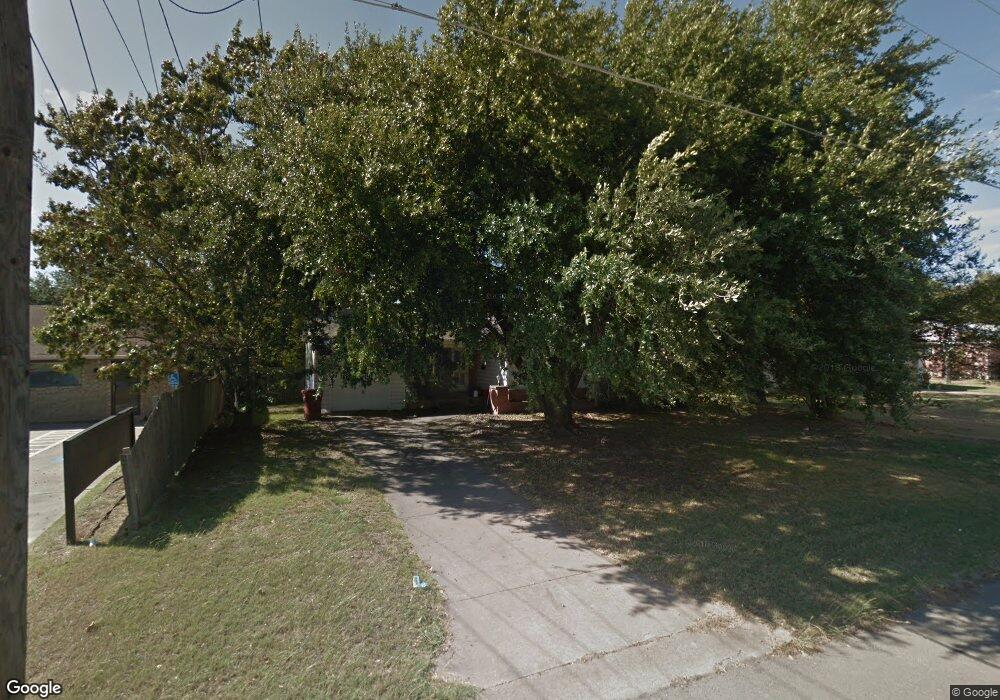
507 Lipscomb St Bonham, TX 75418
Estimated Value: $127,000 - $162,000
2
Beds
1
Bath
870
Sq Ft
$162/Sq Ft
Est. Value
About This Home
This home is located at 507 Lipscomb St, Bonham, TX 75418 and is currently estimated at $141,155, approximately $162 per square foot. 507 Lipscomb St is a home located in Fannin County with nearby schools including Evans Elementary School, Finley-Oates Elementary School, and LH Rather Jr High School.
Ownership History
Date
Name
Owned For
Owner Type
Purchase Details
Closed on
Nov 14, 2019
Sold by
Biggers Robert L and Biggers Jo Anne Atnip
Bought by
Snyder Carrie A
Current Estimated Value
Home Financials for this Owner
Home Financials are based on the most recent Mortgage that was taken out on this home.
Original Mortgage
$61,750
Outstanding Balance
$54,378
Interest Rate
3.65%
Mortgage Type
New Conventional
Estimated Equity
$86,777
Create a Home Valuation Report for This Property
The Home Valuation Report is an in-depth analysis detailing your home's value as well as a comparison with similar homes in the area
Purchase History
| Date | Buyer | Sale Price | Title Company |
|---|---|---|---|
| Snyder Carrie A | -- | Cole Title Co |
Source: Public Records
Mortgage History
| Date | Status | Borrower | Loan Amount |
|---|---|---|---|
| Open | Snyder Carrie A | $61,750 |
Source: Public Records
Tax History
| Year | Tax Paid | Tax Assessment Tax Assessment Total Assessment is a certain percentage of the fair market value that is determined by local assessors to be the total taxable value of land and additions on the property. | Land | Improvement |
|---|---|---|---|---|
| 2025 | $2,048 | $126,960 | $40,040 | $86,920 |
| 2024 | $893 | $121,310 | $39,300 | $82,010 |
| 2023 | $1,720 | $112,080 | $28,990 | $83,090 |
| 2022 | $1,745 | $102,740 | $20,920 | $81,820 |
| 2021 | $1,823 | $72,110 | $10,530 | $61,580 |
| 2020 | $1,679 | $65,700 | $7,700 | $58,000 |
| 2019 | $1,153 | $43,380 | $6,050 | $37,330 |
| 2018 | $933 | $35,170 | $6,050 | $29,120 |
| 2017 | $906 | $35,450 | $6,050 | $29,400 |
| 2016 | $717 | $28,067 | $6,050 | $22,017 |
| 2015 | -- | $31,250 | $5,900 | $25,350 |
| 2014 | -- | $31,610 | $5,830 | $25,780 |
Source: Public Records
Map
Nearby Homes
Your Personal Tour Guide
Ask me questions while you tour the home.