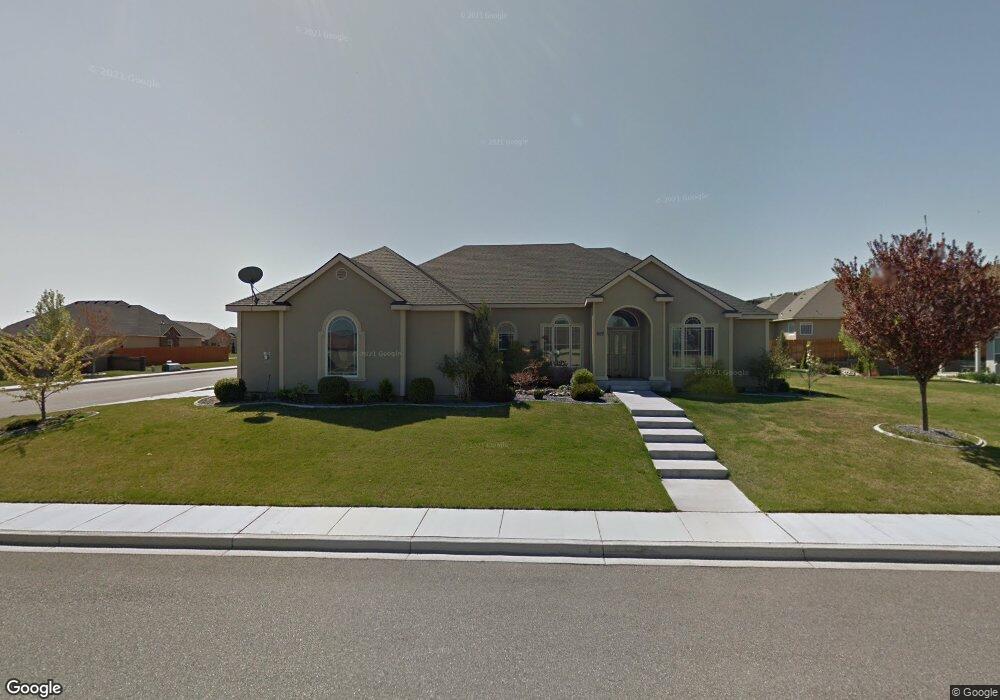
507 Lodi Loop Unit South Richland rambl Richland, WA 99352
Estimated Value: $584,000 - $685,000
3
Beds
3
Baths
2,524
Sq Ft
$248/Sq Ft
Est. Value
About This Home
This home is located at 507 Lodi Loop Unit South Richland rambl, Richland, WA 99352 and is currently estimated at $627,040, approximately $248 per square foot. 507 Lodi Loop Unit South Richland rambl is a home located in Benton County with nearby schools including Orchard Elementary School, Enterprise Middle School, and Richland High School.
Ownership History
Date
Name
Owned For
Owner Type
Purchase Details
Closed on
Jul 21, 2021
Sold by
Zimmerman John C and Zimmerman Martha
Bought by
Alderman Bradley W and Alderman Tamera K
Current Estimated Value
Home Financials for this Owner
Home Financials are based on the most recent Mortgage that was taken out on this home.
Original Mortgage
$210,000
Outstanding Balance
$190,630
Interest Rate
2.93%
Mortgage Type
New Conventional
Estimated Equity
$436,410
Purchase Details
Closed on
Mar 30, 2017
Sold by
Yuan Yong and Chen Xingyuan
Bought by
Zimmerman John C and Zimmerman Martha
Home Financials for this Owner
Home Financials are based on the most recent Mortgage that was taken out on this home.
Original Mortgage
$285,233
Interest Rate
4.16%
Mortgage Type
VA
Purchase Details
Closed on
Jun 4, 2010
Sold by
Madani Mehdi and Madani Beckie M
Bought by
Yuan Yong and Chen Xingyuan
Home Financials for this Owner
Home Financials are based on the most recent Mortgage that was taken out on this home.
Original Mortgage
$288,000
Interest Rate
3.37%
Mortgage Type
New Conventional
Create a Home Valuation Report for This Property
The Home Valuation Report is an in-depth analysis detailing your home's value as well as a comparison with similar homes in the area
Home Values in the Area
Average Home Value in this Area
Purchase History
| Date | Buyer | Sale Price | Title Company |
|---|---|---|---|
| Alderman Bradley W | $520,000 | Ticor Title Company | |
| Zimmerman John C | $370,000 | Stewart Title Company | |
| Yuan Yong | $360,000 | Chicago Title Insurance |
Source: Public Records
Mortgage History
| Date | Status | Borrower | Loan Amount |
|---|---|---|---|
| Open | Alderman Bradley W | $210,000 | |
| Previous Owner | Zimmerman John C | $285,233 | |
| Previous Owner | Yuan Yong | $288,000 |
Source: Public Records
Tax History Compared to Growth
Tax History
| Year | Tax Paid | Tax Assessment Tax Assessment Total Assessment is a certain percentage of the fair market value that is determined by local assessors to be the total taxable value of land and additions on the property. | Land | Improvement |
|---|---|---|---|---|
| 2024 | $4,972 | $546,330 | $85,000 | $461,330 |
| 2023 | $4,972 | $532,760 | $85,000 | $447,760 |
| 2022 | $4,689 | $478,490 | $85,000 | $393,490 |
| 2021 | $4,267 | $424,210 | $85,000 | $339,210 |
| 2020 | $4,549 | $369,940 | $85,000 | $284,940 |
| 2019 | $4,229 | $373,130 | $58,000 | $315,130 |
| 2018 | $4,345 | $373,130 | $58,000 | $315,130 |
| 2017 | $3,839 | $320,610 | $58,000 | $262,610 |
| 2016 | $4,221 | $320,610 | $58,000 | $262,610 |
| 2015 | $3,914 | $320,610 | $58,000 | $262,610 |
| 2014 | -- | $289,910 | $58,000 | $231,910 |
| 2013 | -- | $289,910 | $58,000 | $231,910 |
Source: Public Records
Map
Nearby Homes
- 586 Lodi Loop
- 1472 Chardonnay Dr
- 585 Burton Ct
- 1240 Vintage Ave
- 1269 Jubilee St
- 403 Cherry Blossom Loop
- 1101 Fairhaven Loop
- 652 Punkie Ln
- 1113 Fairhaven Loop Unit 4
- 1117 Fairhaven Loop Unit 5
- 1102 Fairhaven Loop Unit 34
- 713 Mara Loop
- 1557 Livorno Ave
- 766 Mara Loop
- 1106 Fairhaven Loop Unit 33
- 1376 Tuscany Place
- 1638 Naples Ln
- 736 Mara Loop
- 730 Mara Loop
- 430 Keene Rd
- 507 Lodi Loop Unit 3 plus den one story
- 507 Lodi Loop
- 1411 Fuji Way
- 515 Lodi Loop
- 587 Lodi Loop
- 506 Lodi Loop
- 493 Criterion Dr
- 512 Lodi Loop
- 496 Golden Dr
- 523 Lodi Loop Unit Gorgeous Hardwood fl
- 523 Lodi Loop Unit INCREDIBLE "LOW MAIN
- 523 Lodi Loop
- 576 Lodi Loop
- 1392 Fuji Way
- 594 Lodi Loop
- 520 Lodi Loop
- 1369 Fuji Way
- 478 Golden Dr
- 1487 Chardonnay Dr
- 495 Golden Dr