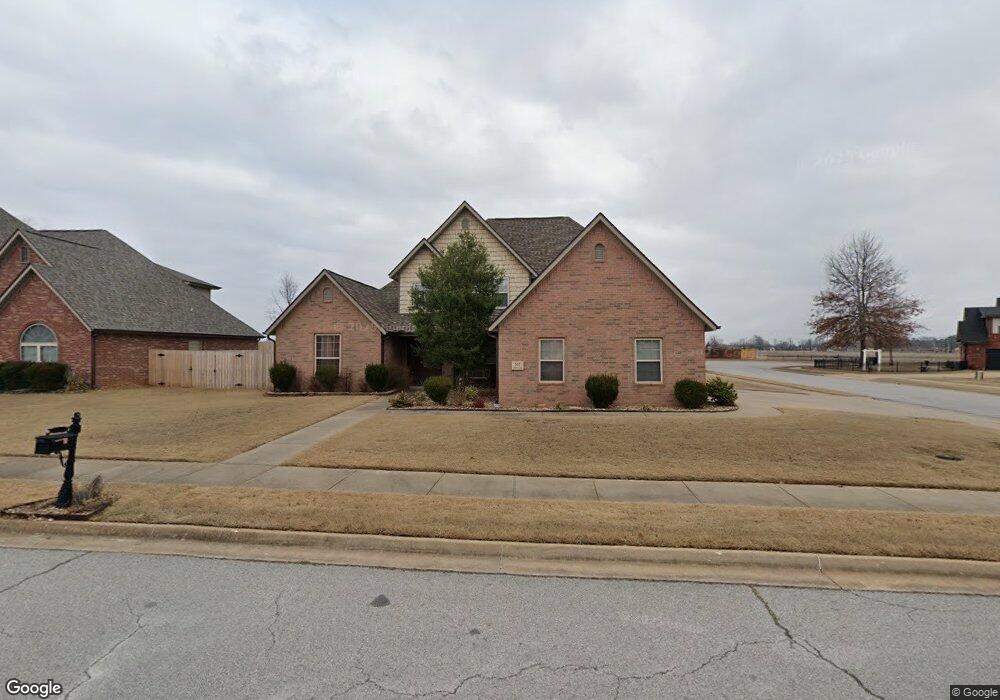
507 Lyndal Ln Bentonville, AR 72712
Estimated Value: $613,000 - $808,000
--
Bed
3
Baths
3,272
Sq Ft
$212/Sq Ft
Est. Value
About This Home
This home is located at 507 Lyndal Ln, Bentonville, AR 72712 and is currently estimated at $694,161, approximately $212 per square foot. 507 Lyndal Ln is a home located in Benton County with nearby schools including Ruth Barker Middle School, Apple Glen Elementary School, and Washington Junior High School.
Ownership History
Date
Name
Owned For
Owner Type
Purchase Details
Closed on
Aug 11, 2011
Sold by
Michaelsamy Britto and Britto Clemens
Bought by
Michaelsamy Britto J and Britto Clemens M
Current Estimated Value
Purchase Details
Closed on
Feb 2, 2006
Sold by
Payne Construction Inc
Bought by
Michaelsamy Britto and Britto Clemens
Home Financials for this Owner
Home Financials are based on the most recent Mortgage that was taken out on this home.
Original Mortgage
$30,700
Outstanding Balance
$17,232
Interest Rate
6.15%
Mortgage Type
Stand Alone Second
Estimated Equity
$676,929
Purchase Details
Closed on
Nov 12, 2004
Bought by
Payne Construction
Purchase Details
Closed on
Nov 10, 2004
Bought by
Payne Construction
Purchase Details
Closed on
Apr 22, 2004
Bought by
Mctab 3P
Create a Home Valuation Report for This Property
The Home Valuation Report is an in-depth analysis detailing your home's value as well as a comparison with similar homes in the area
Home Values in the Area
Average Home Value in this Area
Purchase History
| Date | Buyer | Sale Price | Title Company |
|---|---|---|---|
| Michaelsamy Britto J | -- | None Available | |
| Michaelsamy Britto | $307,000 | Pinnacle Title Llc | |
| Payne Construction | $42,000 | -- | |
| Payne Construction | $42,000 | -- | |
| Mctab 3P | $122,000 | -- |
Source: Public Records
Mortgage History
| Date | Status | Borrower | Loan Amount |
|---|---|---|---|
| Open | Michaelsamy Britto | $30,700 | |
| Open | Michaelsamy Britto | $245,600 |
Source: Public Records
Tax History Compared to Growth
Tax History
| Year | Tax Paid | Tax Assessment Tax Assessment Total Assessment is a certain percentage of the fair market value that is determined by local assessors to be the total taxable value of land and additions on the property. | Land | Improvement |
|---|---|---|---|---|
| 2025 | $4,587 | $110,843 | $19,600 | $91,243 |
| 2024 | $4,398 | $110,843 | $19,600 | $91,243 |
| 2023 | $4,189 | $84,480 | $8,600 | $75,880 |
| 2022 | $3,729 | $84,480 | $8,600 | $75,880 |
| 2021 | $3,529 | $84,480 | $8,600 | $75,880 |
| 2020 | $3,379 | $58,930 | $6,000 | $52,930 |
| 2019 | $3,379 | $58,930 | $6,000 | $52,930 |
| 2018 | $3,404 | $58,930 | $6,000 | $52,930 |
| 2017 | $3,027 | $58,930 | $6,000 | $52,930 |
| 2016 | $3,027 | $58,930 | $6,000 | $52,930 |
| 2015 | $3,222 | $52,130 | $7,000 | $45,130 |
| 2014 | $2,872 | $52,130 | $7,000 | $45,130 |
Source: Public Records
Map
Nearby Homes
- 2806 SE 3rd St
- 2708 Pleasant View Ln
- 2709 Pleasant View Ln
- 2801 SE 3rd St
- 600 Cornell St
- 2512 SE 3rd St
- 2504 SE 4th St
- 901 Watertower Rd
- 903 Water Tower Rd
- 603 Drake St
- 701 Drake St
- 705 Drake St
- 309 SE Eaton St
- 702 SE Eaton St
- 2401 SE 9th St
- 2202 Del White Dr
- 501 NE Whitney St
- 2301 Beth Ln
- 906 Convair St
- 1102 Lockheed St
- 505 Lyndal Ln
- 2903 SE 6th St
- 503 Lyndal Ln
- 601 Lyndal Ln
- 506 Lyndal Ln
- 504 Lyndal Ln
- 600 Lyndal Ln
- 2902 SE 6th St
- 2905 SE 6th St
- 502 Lyndal Ln
- 501 Lyndal Ln
- 602 Lyndal Ln
- 500 Lyndal Ln
- 603 SE Cambridge Place
- 407 Lyndal Ln
- 601 SE Cambridge Place
- 605 SE Cambridge Place
- 604 Lyndal Ln
- 507 SE Cambridge Place
- 607 SE Cambridge Place