Estimated Value: $117,000 - $139,000
3
Beds
2
Baths
1,212
Sq Ft
$105/Sq Ft
Est. Value
About This Home
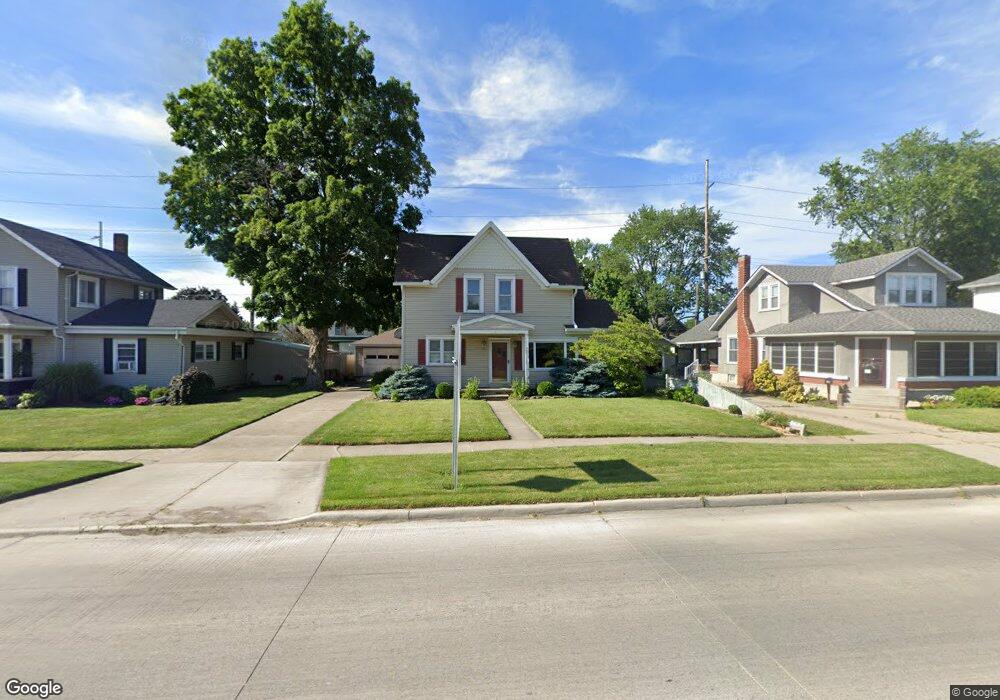
This home is located at 507 Main St, Delta, OH 43515 and is currently estimated at $127,572, approximately $105 per square foot. 507 Main St is a home located in Fulton County with nearby schools including Delta Elementary School, Pike-Delta-York Middle School, and Pike-Delta-York High School.
Ownership History
Date
Name
Owned For
Owner Type
Purchase Details
Closed on
Mar 17, 2011
Sold by
Hsbc Bank Usa N A
Bought by
Mohler Debra
Current Estimated Value
Purchase Details
Closed on
Mar 1, 2010
Sold by
Smith Christopher M
Bought by
Hsbc Bank Usa N A
Purchase Details
Closed on
Jul 20, 2006
Sold by
Shaw Lori L
Bought by
Smith Christopher M and Smith Michelle L
Home Financials for this Owner
Home Financials are based on the most recent Mortgage that was taken out on this home.
Original Mortgage
$84,000
Interest Rate
8.87%
Mortgage Type
Purchase Money Mortgage
Purchase Details
Closed on
Jul 9, 2004
Sold by
Mandly Alan
Bought by
Shaw Lori L
Purchase Details
Closed on
Jan 1, 1990
Bought by
Mandly Alan and Shaw Lori L
Create a Home Valuation Report for This Property
The Home Valuation Report is an in-depth analysis detailing your home's value as well as a comparison with similar homes in the area
Home Values in the Area
Average Home Value in this Area
Purchase History
| Date | Buyer | Sale Price | Title Company |
|---|---|---|---|
| Mohler Debra | $30,200 | None Available | |
| Hsbc Bank Usa N A | $60,000 | None Available | |
| Smith Christopher M | $105,000 | None Available | |
| Shaw Lori L | -- | -- | |
| Mandly Alan | -- | -- |
Source: Public Records
Mortgage History
| Date | Status | Borrower | Loan Amount |
|---|---|---|---|
| Previous Owner | Smith Christopher M | $84,000 |
Source: Public Records
Tax History
| Year | Tax Paid | Tax Assessment Tax Assessment Total Assessment is a certain percentage of the fair market value that is determined by local assessors to be the total taxable value of land and additions on the property. | Land | Improvement |
|---|---|---|---|---|
| 2024 | $1,400 | $29,580 | $5,950 | $23,630 |
| 2023 | $1,289 | $29,580 | $5,950 | $23,630 |
| 2022 | $1,328 | $23,280 | $4,970 | $18,310 |
| 2021 | $1,391 | $23,280 | $4,970 | $18,310 |
| 2020 | $1,367 | $23,280 | $4,970 | $18,310 |
| 2019 | $1,210 | $20,970 | $4,970 | $16,000 |
| 2018 | $960 | $19,600 | $4,970 | $14,630 |
| 2017 | $830 | $14,980 | $4,970 | $10,010 |
| 2016 | $800 | $13,300 | $4,970 | $8,330 |
| 2015 | $765 | $13,300 | $4,970 | $8,330 |
| 2014 | $764 | $13,300 | $4,970 | $8,330 |
| 2013 | $602 | $10,580 | $4,240 | $6,340 |
Source: Public Records
Map
Nearby Homes
- 305 Mckinley St
- 207 Wood St
- 308 Monroe St
- 302 Jackson St
- 8069 Fulton County 7-2
- 8069 County Road 7
- 2049 Pear Tree Ln
- 318 Hidden Ridge Dr
- 2061 Redbud Ln
- 2105 Redbud Ln
- 315 Cherrytree Ln
- 2158 Redbud Ln
- 320 Crabtree Ln
- 9136 County Road Ef
- 5835 County Road 10
- 4800 County Road K
- 3121 County Road Ef
- 9669 County Road 11
- 11470 County Rd E
- 6881 County Road B
Your Personal Tour Guide
Ask me questions while you tour the home.