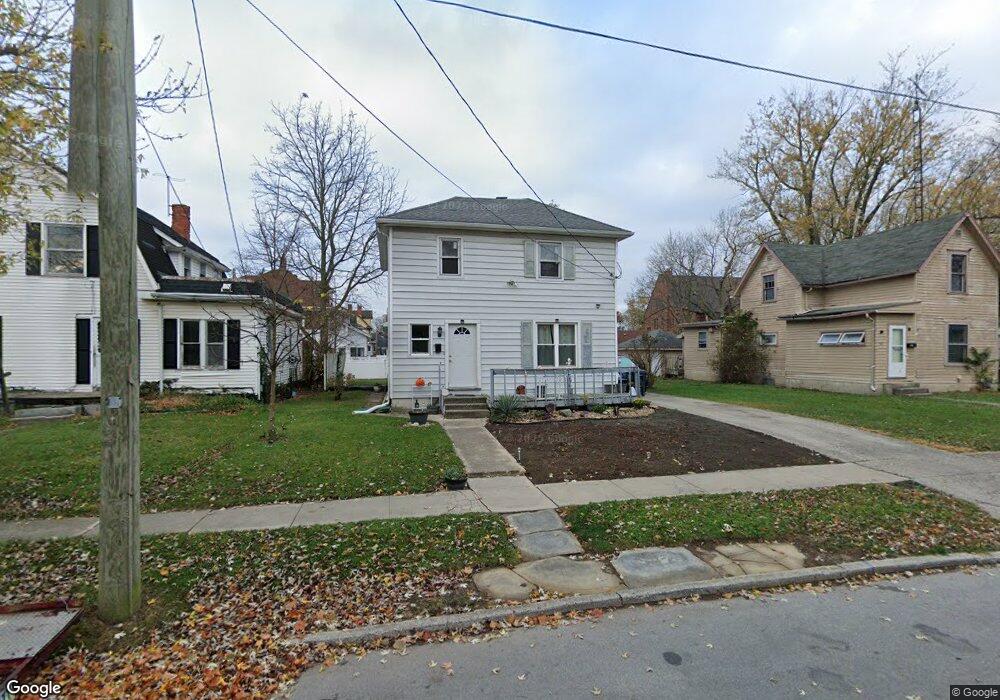
507 N Charles St Lima, OH 45805
Central Lima NeighborhoodEstimated Value: $59,000 - $100,000
3
Beds
2
Baths
1,904
Sq Ft
$40/Sq Ft
Est. Value
About This Home
This home is located at 507 N Charles St, Lima, OH 45805 and is currently estimated at $75,879, approximately $39 per square foot. 507 N Charles St is a home located in Allen County with nearby schools including Heritage Elementary School, Lima North Middle School, and Lima West Middle School.
Ownership History
Date
Name
Owned For
Owner Type
Purchase Details
Closed on
May 23, 2022
Sold by
Randall Staley Thad and Randall Amy N
Bought by
Nickles Josie Lynn
Current Estimated Value
Home Financials for this Owner
Home Financials are based on the most recent Mortgage that was taken out on this home.
Original Mortgage
$41,650
Outstanding Balance
$34,622
Interest Rate
4.43%
Mortgage Type
New Conventional
Estimated Equity
$41,257
Purchase Details
Closed on
Dec 9, 1999
Sold by
Pracht Vivian
Bought by
Staley Thad R and Staley Amy N
Home Financials for this Owner
Home Financials are based on the most recent Mortgage that was taken out on this home.
Original Mortgage
$33,600
Interest Rate
8.02%
Mortgage Type
New Conventional
Purchase Details
Closed on
Jan 1, 1990
Bought by
Pracht Vivian
Create a Home Valuation Report for This Property
The Home Valuation Report is an in-depth analysis detailing your home's value as well as a comparison with similar homes in the area
Home Values in the Area
Average Home Value in this Area
Purchase History
| Date | Buyer | Sale Price | Title Company |
|---|---|---|---|
| Nickles Josie Lynn | $49,000 | Basinger Scott L | |
| Staley Thad R | $42,000 | -- | |
| Pracht Vivian | -- | -- |
Source: Public Records
Mortgage History
| Date | Status | Borrower | Loan Amount |
|---|---|---|---|
| Open | Nickles Josie Lynn | $41,650 | |
| Previous Owner | Staley Thad R | $33,600 |
Source: Public Records
Tax History Compared to Growth
Tax History
| Year | Tax Paid | Tax Assessment Tax Assessment Total Assessment is a certain percentage of the fair market value that is determined by local assessors to be the total taxable value of land and additions on the property. | Land | Improvement |
|---|---|---|---|---|
| 2024 | $770 | $20,650 | $2,450 | $18,200 |
| 2023 | $772 | $18,100 | $2,140 | $15,960 |
| 2022 | $795 | $18,100 | $2,140 | $15,960 |
| 2021 | $842 | $18,100 | $2,140 | $15,960 |
| 2020 | $826 | $15,720 | $2,070 | $13,650 |
| 2019 | $826 | $15,720 | $2,070 | $13,650 |
| 2018 | $823 | $15,720 | $2,070 | $13,650 |
| 2017 | $829 | $15,720 | $2,070 | $13,650 |
| 2016 | $840 | $15,720 | $2,070 | $13,650 |
| 2015 | $911 | $15,720 | $2,070 | $13,650 |
| 2014 | $911 | $16,880 | $2,210 | $14,670 |
| 2013 | $887 | $16,880 | $2,210 | $14,670 |
Source: Public Records
Map
Nearby Homes
- 618 Woodward Ave
- 1120 Richie Ave
- 1036 W High St
- 1023 Leland Ave
- 1206 Rice Ave
- 745 Brice Ave
- 631 Hazel Ave
- 648 Hazel Ave
- 638 Hazel Ave
- 627 Brice Ave
- 676 Cortlandt Ave
- 612 N Metcalf St
- 708 N Metcalf St
- 434 N Washington St
- 1517 Allentown Rd
- 233 S Kenilworth Ave
- 576 Cortlandt Ave
- 343 S Charles St
- 705 W Elm St
- 325 N McDonel St
- 513 N Charles St
- 503 N Charles St
- 1010 Brice Ave
- 1012 Brice Ave
- 1014 Brice Ave
- 992 Brice Ave
- 1020 Brice Ave
- 510 N Charles St
- 521 N Charles St
- 988 Brice Ave
- 1007 Brice Ave
- 1022 Brice Ave
- 1011 Richie Ave
- 986 Brice Ave
- 531 N Charles St
- 981 Richie Ave
- 1028 Brice Ave
- 1101-1017 N Jameson Ave
- 989 Brice Ave 420 N Charles