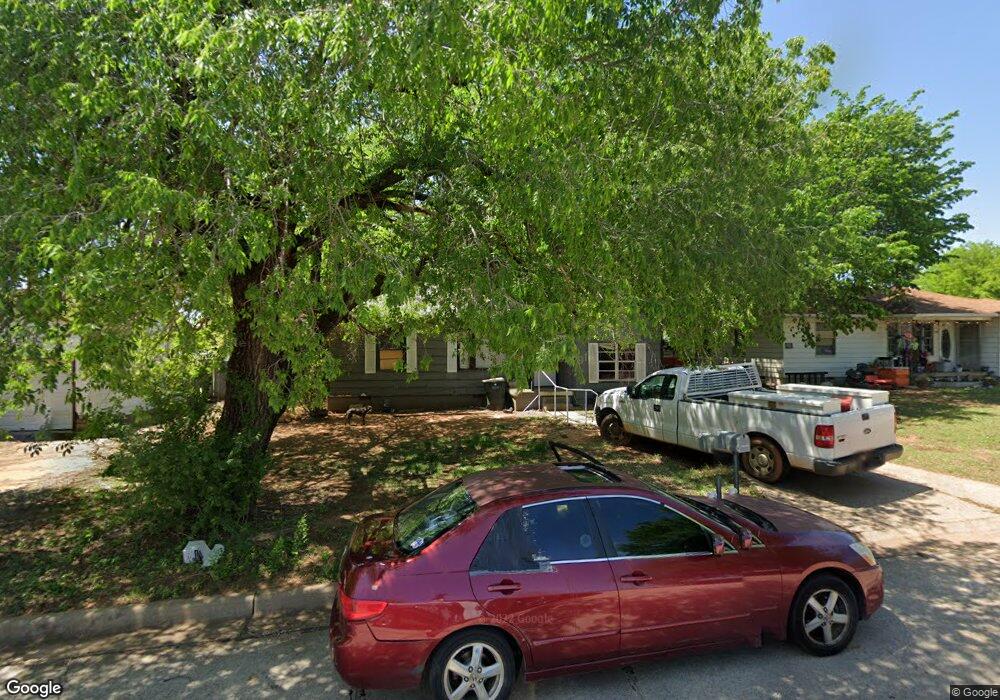
507 N G St Duncan, OK 73533
Estimated Value: $54,853 - $62,000
3
Beds
1
Bath
1,207
Sq Ft
$48/Sq Ft
Est. Value
About This Home
This home is located at 507 N G St, Duncan, OK 73533 and is currently estimated at $57,463, approximately $47 per square foot. 507 N G St is a home located in Stephens County with nearby schools including Woodrow Wilson Elementary School, Duncan Middle School, and Duncan High School.
Ownership History
Date
Name
Owned For
Owner Type
Purchase Details
Closed on
Feb 5, 2011
Sold by
Huff William D
Bought by
Gatliff Frances A
Current Estimated Value
Home Financials for this Owner
Home Financials are based on the most recent Mortgage that was taken out on this home.
Original Mortgage
$32,500
Interest Rate
10%
Mortgage Type
Purchase Money Mortgage
Purchase Details
Closed on
Jun 28, 2005
Sold by
Warren Robert C and Warren Carla K
Bought by
Huff William D and Huff Patricia A
Home Financials for this Owner
Home Financials are based on the most recent Mortgage that was taken out on this home.
Original Mortgage
$28,500
Interest Rate
8.5%
Mortgage Type
Purchase Money Mortgage
Purchase Details
Closed on
Jan 18, 2005
Sold by
Gallaher Jerry L and Gallaher Jamie R
Bought by
Huff William D and Huff Patricia A
Purchase Details
Closed on
Aug 25, 2001
Sold by
Huff William and Huff Patricia
Create a Home Valuation Report for This Property
The Home Valuation Report is an in-depth analysis detailing your home's value as well as a comparison with similar homes in the area
Home Values in the Area
Average Home Value in this Area
Purchase History
| Date | Buyer | Sale Price | Title Company |
|---|---|---|---|
| Gatliff Frances A | $32,500 | None Available | |
| Huff William D | -- | None Available | |
| Warren Robert C | $29,500 | None Available | |
| Huff William D | -- | None Available | |
| -- | $26,000 | -- |
Source: Public Records
Mortgage History
| Date | Status | Borrower | Loan Amount |
|---|---|---|---|
| Previous Owner | Gatliff Frances A | $32,500 | |
| Previous Owner | Warren Robert C | $28,500 |
Source: Public Records
Tax History Compared to Growth
Tax History
| Year | Tax Paid | Tax Assessment Tax Assessment Total Assessment is a certain percentage of the fair market value that is determined by local assessors to be the total taxable value of land and additions on the property. | Land | Improvement |
|---|---|---|---|---|
| 2025 | $175 | $2,070 | $482 | $1,588 |
| 2024 | $168 | $1,971 | $482 | $1,489 |
| 2023 | $168 | $1,972 | $482 | $1,490 |
| 2022 | $152 | $1,788 | $482 | $1,306 |
| 2021 | $268 | $3,147 | $482 | $2,665 |
| 2020 | $247 | $2,855 | $482 | $2,373 |
| 2019 | $243 | $2,804 | $482 | $2,322 |
| 2018 | $250 | $2,804 | $482 | $2,322 |
| 2017 | $241 | $2,799 | $482 | $2,317 |
| 2016 | $242 | $2,844 | $482 | $2,362 |
| 2015 | $312 | $3,393 | $482 | $2,911 |
| 2014 | $312 | $3,393 | $482 | $2,911 |
Source: Public Records
Map
Nearby Homes