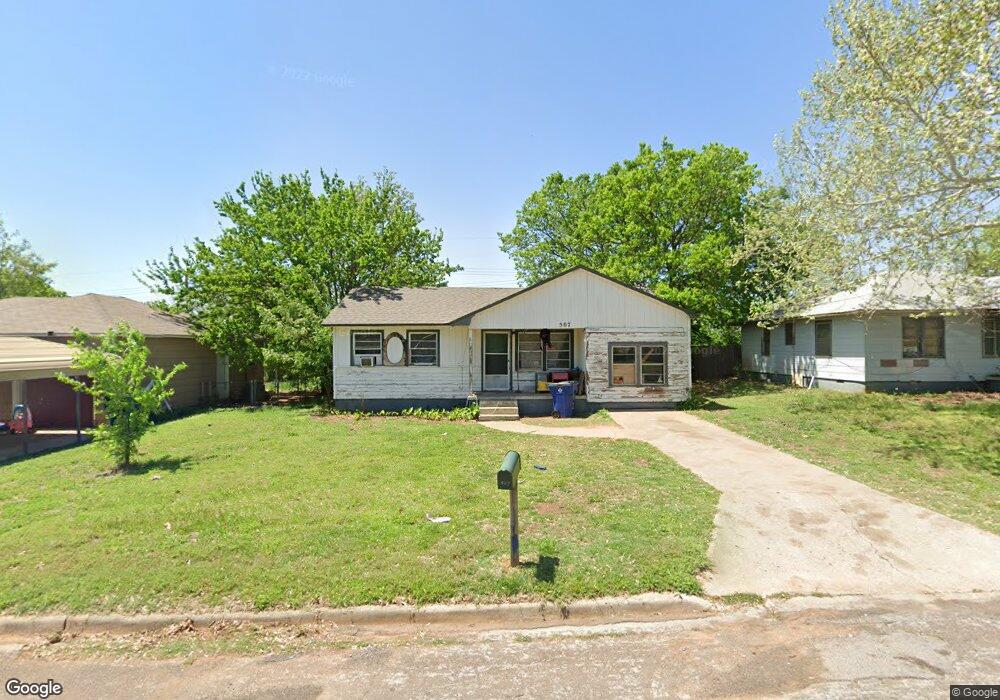
507 N H St Duncan, OK 73533
Estimated Value: $47,362 - $87,000
3
Beds
1
Bath
1,035
Sq Ft
$58/Sq Ft
Est. Value
About This Home
This home is located at 507 N H St, Duncan, OK 73533 and is currently estimated at $59,841, approximately $57 per square foot. 507 N H St is a home located in Stephens County with nearby schools including Woodrow Wilson Elementary School, Duncan Middle School, and Duncan High School.
Ownership History
Date
Name
Owned For
Owner Type
Purchase Details
Closed on
May 25, 2022
Sold by
David Ballard
Bought by
Benson William and Benson Ronda
Current Estimated Value
Purchase Details
Closed on
May 13, 2005
Sold by
Swartz & Brough Inc
Bought by
Scott Paula Y
Home Financials for this Owner
Home Financials are based on the most recent Mortgage that was taken out on this home.
Original Mortgage
$14,101
Interest Rate
5.78%
Mortgage Type
FHA
Purchase Details
Closed on
Jul 15, 2003
Sold by
Strange David L and Strange Nancy
Purchase Details
Closed on
May 12, 2003
Sold by
Strange David L and Strange Nancy
Create a Home Valuation Report for This Property
The Home Valuation Report is an in-depth analysis detailing your home's value as well as a comparison with similar homes in the area
Home Values in the Area
Average Home Value in this Area
Purchase History
| Date | Buyer | Sale Price | Title Company |
|---|---|---|---|
| Benson William | $3,000 | None Listed On Document | |
| Scott Paula Y | $16,000 | None Available | |
| -- | -- | -- | |
| -- | $10,500 | -- |
Source: Public Records
Mortgage History
| Date | Status | Borrower | Loan Amount |
|---|---|---|---|
| Previous Owner | Scott Paula Y | $14,101 |
Source: Public Records
Tax History Compared to Growth
Tax History
| Year | Tax Paid | Tax Assessment Tax Assessment Total Assessment is a certain percentage of the fair market value that is determined by local assessors to be the total taxable value of land and additions on the property. | Land | Improvement |
|---|---|---|---|---|
| 2025 | $217 | $2,571 | $494 | $2,077 |
| 2024 | $223 | $2,614 | $494 | $2,120 |
| 2023 | $223 | $2,823 | $494 | $2,329 |
| 2022 | $198 | $2,334 | $494 | $1,840 |
| 2021 | $289 | $3,400 | $494 | $2,906 |
| 2020 | $266 | $3,084 | $494 | $2,590 |
| 2019 | $262 | $3,031 | $494 | $2,537 |
| 2018 | $257 | $3,031 | $494 | $2,537 |
| 2017 | $236 | $2,855 | $494 | $2,361 |
| 2016 | $223 | $2,618 | $494 | $2,124 |
| 2015 | $182 | $2,618 | $494 | $2,124 |
| 2014 | $182 | $2,618 | $494 | $2,124 |
Source: Public Records
Map
Nearby Homes