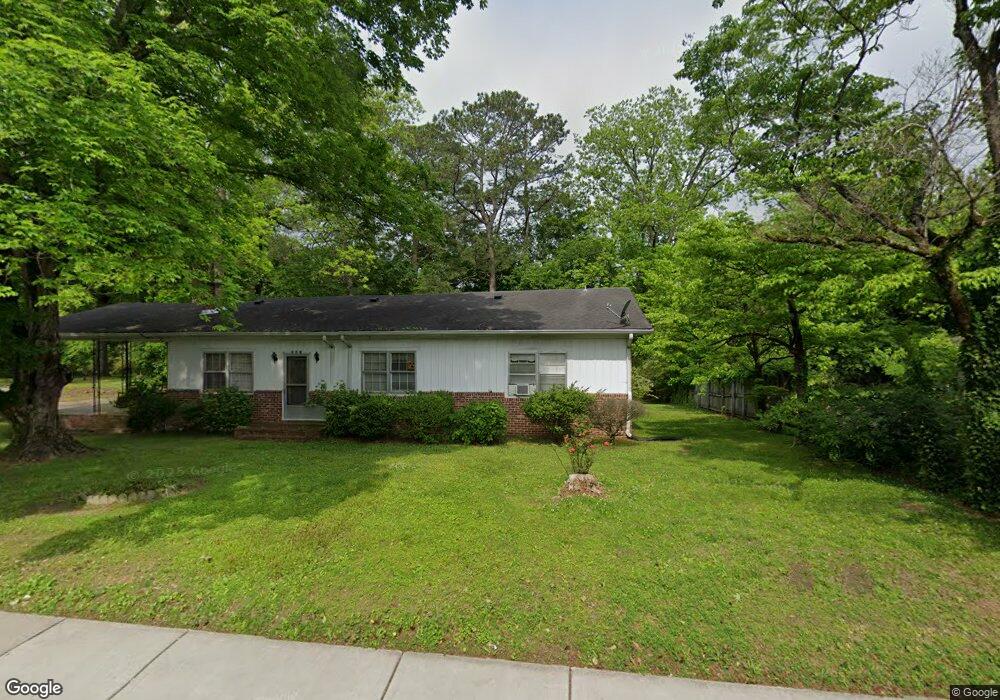
507 N Main St La Fayette, GA 30728
Estimated Value: $193,620 - $239,000
--
Bed
2
Baths
2,087
Sq Ft
$108/Sq Ft
Est. Value
About This Home
This home is located at 507 N Main St, La Fayette, GA 30728 and is currently estimated at $225,655, approximately $108 per square foot. 507 N Main St is a home located in Walker County with nearby schools including North Lafayette Elementary School, Lafayette Middle School, and Lafayette High School.
Ownership History
Date
Name
Owned For
Owner Type
Purchase Details
Closed on
Sep 20, 2018
Sold by
Molnar Randall Gregory
Bought by
Molnar Barbara Ann and Molnar Randall Gregory
Current Estimated Value
Home Financials for this Owner
Home Financials are based on the most recent Mortgage that was taken out on this home.
Original Mortgage
$85,000
Outstanding Balance
$73,972
Interest Rate
4.5%
Mortgage Type
New Conventional
Estimated Equity
$151,683
Purchase Details
Closed on
Mar 16, 2015
Sold by
Gould Mary Evelyn
Bought by
Molnar Randall Gregory
Purchase Details
Closed on
Jan 1, 1990
Sold by
Gould Mary E
Bought by
Gould Mary E
Purchase Details
Closed on
Dec 4, 1987
Sold by
Richardson Mary R and Richardson
Bought by
Gould Mary E
Purchase Details
Closed on
Sep 1, 1986
Sold by
Richardson J E
Bought by
Richardson Mary R and Richardson
Purchase Details
Closed on
Jan 1, 1972
Bought by
Richardson J E
Create a Home Valuation Report for This Property
The Home Valuation Report is an in-depth analysis detailing your home's value as well as a comparison with similar homes in the area
Home Values in the Area
Average Home Value in this Area
Purchase History
| Date | Buyer | Sale Price | Title Company |
|---|---|---|---|
| Molnar Barbara Ann | -- | -- | |
| Molnar Randall Gregory | -- | -- | |
| Gould Mary E | -- | -- | |
| Gould Mary E | -- | -- | |
| Richardson Mary R | -- | -- | |
| Richardson J E | -- | -- |
Source: Public Records
Mortgage History
| Date | Status | Borrower | Loan Amount |
|---|---|---|---|
| Open | Molnar Barbara Ann | $85,000 |
Source: Public Records
Tax History Compared to Growth
Tax History
| Year | Tax Paid | Tax Assessment Tax Assessment Total Assessment is a certain percentage of the fair market value that is determined by local assessors to be the total taxable value of land and additions on the property. | Land | Improvement |
|---|---|---|---|---|
| 2024 | $850 | $74,899 | $7,122 | $67,777 |
| 2023 | $1,562 | $71,308 | $7,122 | $64,186 |
| 2022 | $1,432 | $62,142 | $7,122 | $55,020 |
| 2021 | $1,287 | $51,369 | $7,122 | $44,247 |
| 2020 | $1,103 | $43,359 | $7,122 | $36,237 |
| 2019 | $1,104 | $43,359 | $7,122 | $36,237 |
| 2018 | $1,303 | $43,783 | $7,546 | $36,237 |
| 2017 | $1,248 | $43,306 | $7,546 | $35,760 |
| 2016 | $1,194 | $43,306 | $7,546 | $35,760 |
| 2015 | -- | $48,586 | $14,256 | $34,330 |
| 2014 | -- | $48,586 | $14,256 | $34,330 |
| 2013 | -- | $48,586 | $14,256 | $34,330 |
Source: Public Records
Map
Nearby Homes
- 0 Center St Unit 1517720
- 307 Park St
- 214 East Ave
- 7552 Us Highway 27
- 207 Culberson Ave
- 13 Steele St N
- 1001 N Main St
- 21058 Georgia 193
- 3 Fortune St
- 0 Fortune St Unit 1520483
- 0 Farris St Unit 1512317
- 0 Farris St
- 1 & 3 N High St
- 212 S High St
- 114 Mallard Ln
- 304 S Cherokee St
- 111 Dove Dr
- 204 S High St
- 307 S Duke St
- 702.5 Henderson St
- 104 Duvall Ln
- 102 Duvall Ln
- 509 N Main St
- 0 Duvall Ln Unit 20127979
- 0 Duvall Ln Unit 1374943
- 0 Duvall Ln Unit 1269868
- 0 Duvall Ln Unit 1046349
- 0 Duvall Ln Unit 1168455
- 0 Duvall Ln Unit 1070899
- 0 Duvall Ln Unit 1352211
- 0 Duvall Ln Unit 20029043
- 0 Duvall Ln Unit 3122773
- 0 Duvall Ln Unit 8341152
- 0 Duvall Ln Unit 1332786
- 0 Duvall Ln Unit 8946021
- 0 Duvall Ln Unit 1107849
- 0 Duvall Ln Unit 1107848
- 0 Duvall Ln Unit 1306405
- 508 N Main St
- 512 N Main St