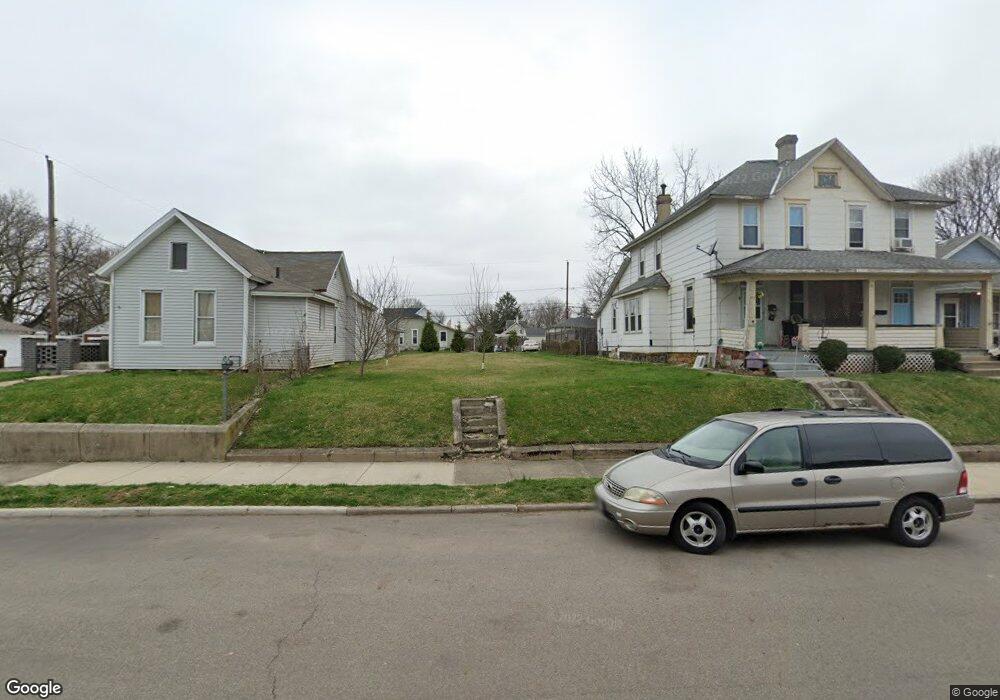
507 N Race St Springfield, OH 45504
Estimated Value: $81,429 - $108,000
2
Beds
1
Bath
962
Sq Ft
$99/Sq Ft
Est. Value
About This Home
This home is located at 507 N Race St, Springfield, OH 45504 and is currently estimated at $95,607, approximately $99 per square foot. 507 N Race St is a home located in Clark County with nearby schools including Snyder Park Elementary School, Roosevelt Middle School, and Springfield High School.
Ownership History
Date
Name
Owned For
Owner Type
Purchase Details
Closed on
Jul 31, 2017
Sold by
Clak County Reutilization Corp
Bought by
Chapman Minniel E and Coonrod Stephanie
Current Estimated Value
Purchase Details
Closed on
Jul 18, 2016
Sold by
Clark County
Bought by
Clark County Land Reutilization Corp
Purchase Details
Closed on
Jan 12, 2007
Sold by
Hall Joseph L
Bought by
Esthers Brandon D
Home Financials for this Owner
Home Financials are based on the most recent Mortgage that was taken out on this home.
Original Mortgage
$57,800
Interest Rate
9.25%
Mortgage Type
Purchase Money Mortgage
Purchase Details
Closed on
Aug 25, 2006
Sold by
Radford Jerry D
Bought by
Hall Joseph L
Home Financials for this Owner
Home Financials are based on the most recent Mortgage that was taken out on this home.
Original Mortgage
$40,500
Interest Rate
6.7%
Mortgage Type
Balloon
Create a Home Valuation Report for This Property
The Home Valuation Report is an in-depth analysis detailing your home's value as well as a comparison with similar homes in the area
Home Values in the Area
Average Home Value in this Area
Purchase History
| Date | Buyer | Sale Price | Title Company |
|---|---|---|---|
| Chapman Minniel E | -- | Dhio Real Estate Title | |
| Clark County Land Reutilization Corp | -- | None Available | |
| Esthers Brandon D | $68,000 | Partners Land Title Agency | |
| Hall Joseph L | $45,600 | Rels Title |
Source: Public Records
Mortgage History
| Date | Status | Borrower | Loan Amount |
|---|---|---|---|
| Previous Owner | Esthers Brandon D | $57,800 | |
| Previous Owner | Hall Joseph L | $40,500 |
Source: Public Records
Tax History Compared to Growth
Tax History
| Year | Tax Paid | Tax Assessment Tax Assessment Total Assessment is a certain percentage of the fair market value that is determined by local assessors to be the total taxable value of land and additions on the property. | Land | Improvement |
|---|---|---|---|---|
| 2024 | $393 | $1,750 | $1,750 | -- |
| 2023 | $807 | $1,750 | $1,750 | $0 |
| 2022 | $612 | $1,750 | $1,750 | $0 |
| 2021 | $386 | $1,450 | $1,450 | $0 |
| 2020 | $386 | $1,450 | $1,450 | $0 |
| 2019 | $386 | $1,450 | $1,450 | $0 |
| 2018 | $98 | $1,700 | $1,700 | $0 |
| 2017 | $0 | $1,701 | $1,701 | $0 |
| 2016 | $0 | $9,513 | $3,402 | $6,111 |
| 2015 | $11,179 | $9,916 | $3,402 | $6,514 |
| 2014 | $563 | $9,916 | $3,402 | $6,514 |
| 2013 | $7,758 | $9,916 | $3,402 | $6,514 |
Source: Public Records
Map
Nearby Homes
- 222 N Race St Unit 224
- 522 W North St Unit 524
- 423 N Jackson St Unit 425
- 101`103 N Western
- 0 S Plum St
- 366 N Isabella St
- 120 E Ward St
- 1120 W High St
- 1009 N Lowry Ave
- 1009 W High St
- 20 N Center St
- 25 Mill Run Place
- 681 W Jefferson St Unit 683
- 1205 W High St
- 29 E Ward St
- 33-35 E Ward St
- 317 S Plum St
- 38 W High St Unit 3B
- 1420 Parker Ct
- 1015 Hillcrest Ave