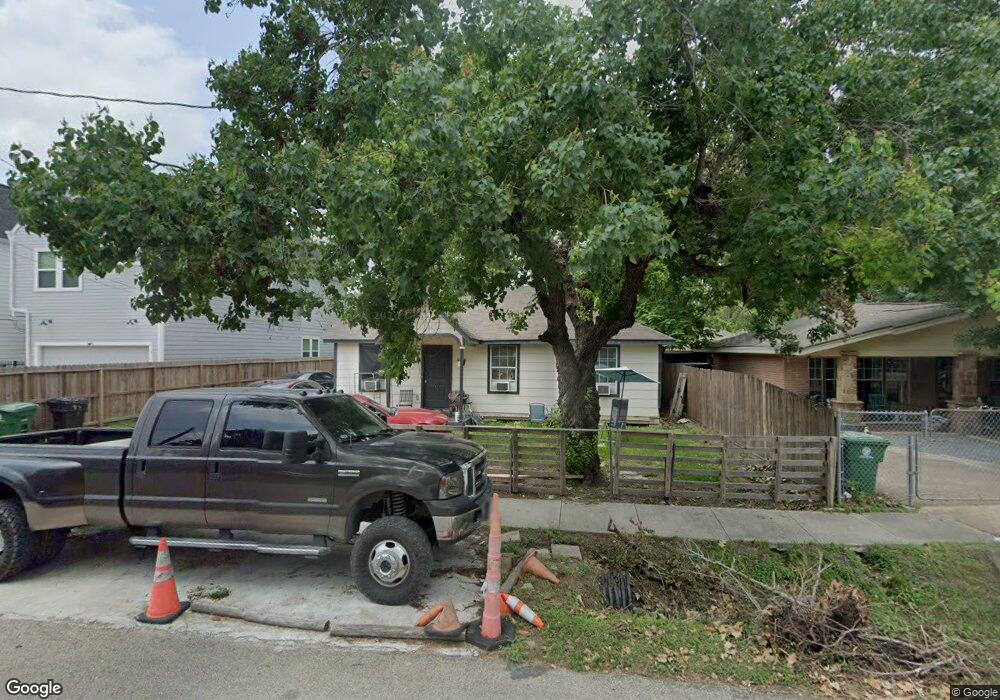
507 Neyland St Houston, TX 77022
Independence Heights NeighborhoodEstimated Value: $170,000 - $188,278
2
Beds
1
Bath
964
Sq Ft
$188/Sq Ft
Est. Value
About This Home
This home is located at 507 Neyland St, Houston, TX 77022 and is currently estimated at $180,820, approximately $187 per square foot. 507 Neyland St is a home located in Harris County with nearby schools including Kennedy Elementary School, Williams Middle, and Booker T Washington Sr High.
Ownership History
Date
Name
Owned For
Owner Type
Purchase Details
Closed on
Jul 1, 2015
Sold by
Vistamont Management Inc
Bought by
Davis Kendalia
Current Estimated Value
Home Financials for this Owner
Home Financials are based on the most recent Mortgage that was taken out on this home.
Original Mortgage
$89,550
Interest Rate
4.03%
Mortgage Type
Purchase Money Mortgage
Purchase Details
Closed on
Jul 1, 2014
Sold by
Barron Jose
Bought by
Vistamont Management Inc
Purchase Details
Closed on
Feb 24, 2009
Sold by
Vistamont Management Inc
Bought by
Barron Jose
Purchase Details
Closed on
Oct 30, 2008
Sold by
Henderson Stephanie Yvette and Eaton Jackie
Bought by
Vistamont Management Inc
Create a Home Valuation Report for This Property
The Home Valuation Report is an in-depth analysis detailing your home's value as well as a comparison with similar homes in the area
Home Values in the Area
Average Home Value in this Area
Purchase History
| Date | Buyer | Sale Price | Title Company |
|---|---|---|---|
| Davis Kendalia | -- | None Available | |
| Vistamont Management Inc | $60,676 | None Available | |
| Barron Jose | -- | None Available | |
| Vistamont Management Inc | -- | Veritas Title |
Source: Public Records
Mortgage History
| Date | Status | Borrower | Loan Amount |
|---|---|---|---|
| Previous Owner | Davis Kendalia | $89,550 | |
| Closed | Barron Jose | $0 |
Source: Public Records
Tax History Compared to Growth
Tax History
| Year | Tax Paid | Tax Assessment Tax Assessment Total Assessment is a certain percentage of the fair market value that is determined by local assessors to be the total taxable value of land and additions on the property. | Land | Improvement |
|---|---|---|---|---|
| 2025 | $1,086 | $186,238 | $156,195 | $30,043 |
| 2024 | $1,086 | $188,838 | $156,195 | $32,643 |
| 2023 | $1,086 | $165,653 | $138,840 | $26,813 |
| 2022 | $2,013 | $165,653 | $138,840 | $26,813 |
| 2021 | $1,937 | $135,087 | $109,915 | $25,172 |
| 2020 | $1,829 | $126,859 | $104,130 | $22,729 |
| 2019 | $1,738 | $83,882 | $52,065 | $31,817 |
| 2018 | $968 | $75,000 | $52,065 | $22,935 |
| 2017 | $1,435 | $65,357 | $34,710 | $30,647 |
| 2016 | $1,305 | $51,597 | $23,140 | $28,457 |
| 2015 | $1,199 | $51,797 | $23,140 | $28,657 |
| 2014 | $1,199 | $46,635 | $15,909 | $30,726 |
Source: Public Records
Map
Nearby Homes
- 435 Neyland St
- 431 Neyland St
- 434 Barkley St
- 436 Neyland St Unit 1
- 508 Neyland St
- 4206 Oxford St
- 603 Neyland
- 412 E Neyland St Unit F
- 412 E Neyland St Unit G
- 412 E Neyland St Unit E
- 515 E 43rd St
- 4333 Arlington St
- 4329 Arlington St
- 4325 Arlington St
- 502 W Crosstimbers St
- 332 Neyland St
- 4303 Cadmus St
- 330 Neyland St
- 326 Neyland St
- 328 Neyland St
- 509 Neyland St
- 505 Neyland St
- 505 Neyland St Unit B
- 505 Neyland St Unit C
- 505 Neyland St Unit A
- 522 Barkley St
- 518 Barkley St
- 511 Neyland St
- 503 Neyland St
- 514 Barkley St
- 530 Barkley St
- 506 Neyland St
- 510 Neyland St
- 504 Neyland St
- 510 Barkley St
- 429 Neyland St
- 4105 Oxford St
- 4305 Oxford St
- 432 Neyland St
- 506 Barkley St