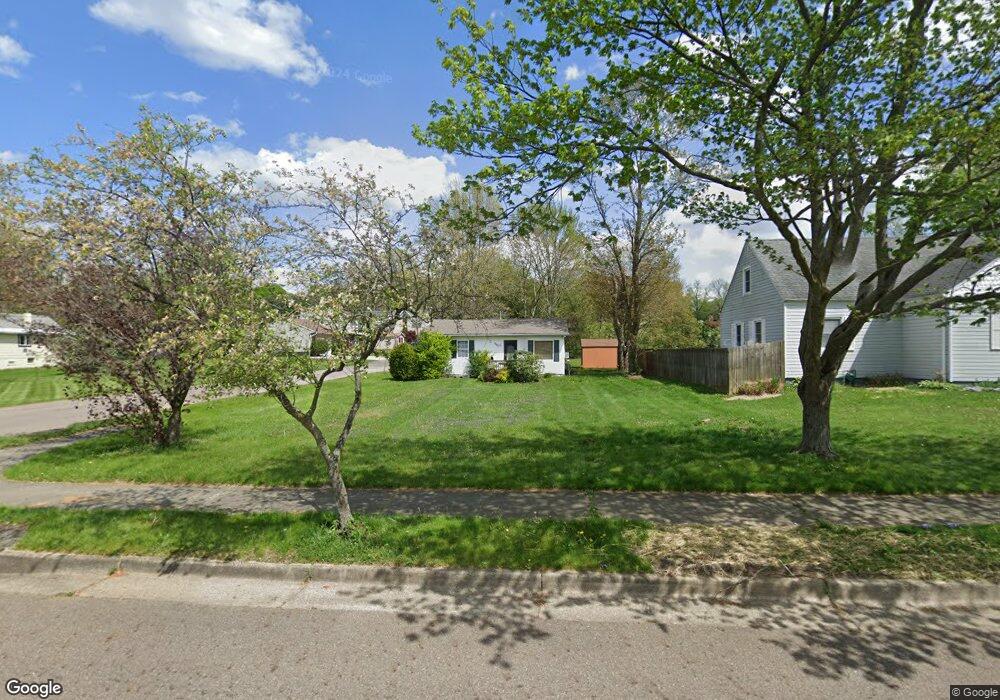
507 Pauline Ave Akron, OH 44312
Ellet NeighborhoodEstimated Value: $84,000 - $114,000
2
Beds
1
Bath
640
Sq Ft
$155/Sq Ft
Est. Value
About This Home
This home is located at 507 Pauline Ave, Akron, OH 44312 and is currently estimated at $99,054, approximately $154 per square foot. 507 Pauline Ave is a home located in Summit County with nearby schools including Ellet High School, Summit Academy Akron Elementary School, and Hatton Community Learning Center.
Ownership History
Date
Name
Owned For
Owner Type
Purchase Details
Closed on
Aug 6, 2018
Sold by
Savoldi Joseph and Savoldi Loyce Jane
Bought by
Savoldi Joseph and Savoldi Loyce Jane
Current Estimated Value
Purchase Details
Closed on
Aug 23, 2006
Sold by
Savoldi Joseph and Savoldi Jean
Bought by
Savoldi Joseph and Savoldi Loyce Jane
Purchase Details
Closed on
Jul 4, 2000
Sold by
Williams Danny A
Bought by
Savoldi Joseph and Savoldi Jean
Purchase Details
Closed on
Oct 10, 1997
Sold by
Pierce Debra K
Bought by
Williams Danny A
Purchase Details
Closed on
May 14, 1997
Sold by
Nicely Edward G
Bought by
Williams Danny A and Pierce Debra K
Home Financials for this Owner
Home Financials are based on the most recent Mortgage that was taken out on this home.
Original Mortgage
$55,215
Interest Rate
8.27%
Mortgage Type
FHA
Create a Home Valuation Report for This Property
The Home Valuation Report is an in-depth analysis detailing your home's value as well as a comparison with similar homes in the area
Home Values in the Area
Average Home Value in this Area
Purchase History
| Date | Buyer | Sale Price | Title Company |
|---|---|---|---|
| Savoldi Joseph | -- | None Available | |
| Savoldi Joseph | -- | None Available | |
| Savoldi Joseph | $58,000 | Midland Commerce Group | |
| Williams Danny A | $18,270 | -- | |
| Williams Danny A | $55,270 | -- |
Source: Public Records
Mortgage History
| Date | Status | Borrower | Loan Amount |
|---|---|---|---|
| Previous Owner | Williams Danny A | $55,215 |
Source: Public Records
Tax History Compared to Growth
Tax History
| Year | Tax Paid | Tax Assessment Tax Assessment Total Assessment is a certain percentage of the fair market value that is determined by local assessors to be the total taxable value of land and additions on the property. | Land | Improvement |
|---|---|---|---|---|
| 2025 | $1,631 | $27,336 | $9,853 | $17,483 |
| 2024 | $1,631 | $27,336 | $9,853 | $17,483 |
| 2023 | $1,631 | $27,336 | $9,853 | $17,483 |
| 2022 | $1,446 | $18,722 | $6,748 | $11,974 |
| 2021 | $1,447 | $18,722 | $6,748 | $11,974 |
| 2020 | $1,428 | $18,720 | $6,750 | $11,970 |
| 2019 | $1,364 | $16,120 | $6,750 | $9,370 |
| 2018 | $1,348 | $16,120 | $6,750 | $9,370 |
| 2017 | $1,291 | $16,120 | $6,750 | $9,370 |
| 2016 | $1,292 | $15,070 | $6,750 | $8,320 |
| 2015 | $1,291 | $15,070 | $6,750 | $8,320 |
| 2014 | $1,282 | $15,070 | $6,750 | $8,320 |
| 2013 | $1,344 | $16,280 | $6,750 | $9,530 |
Source: Public Records
Map
Nearby Homes
- 544 Dennison Ave
- 379 Stull Ave
- 648 Alta Vista Ave
- 2948 Trenton Rd
- 307 Pauline Ave
- 490 Stevenson Ave
- 480 Wirth Ave
- 0 Kreiner Ave
- 2835 Farmdale Rd
- 412 Stevenson Ave
- 440 Wirth Ave
- 200 Stull Ave
- 905 1/2 Shadybrook Dr
- 117 Kreiner Ave
- 2809 McElwain Rd
- 2487 Delaware Ave
- 423 Stetler Ave
- 256 High Grove Blvd
- 1200 Abington Rd
- 2941 Old Home Rd
- 513 Pauline Ave
- 497 Pauline Ave
- 2931 Priscilla Ave
- 491 Pauline Ave
- 519 Pauline Ave
- 525 Pauline Ave
- 484 Stull Ave
- 478 Stull Ave
- 531 Pauline Ave
- 472 Stull Ave
- 508 Pauline Ave
- 516 Pauline Ave
- 537 Pauline Ave
- 479 Pauline Ave
- 520 Pauline Ave
- 496 Pauline Ave
- 466 Stull Ave
- 532 Pauline Ave
- 526 Pauline Ave
- 541 Pauline Ave