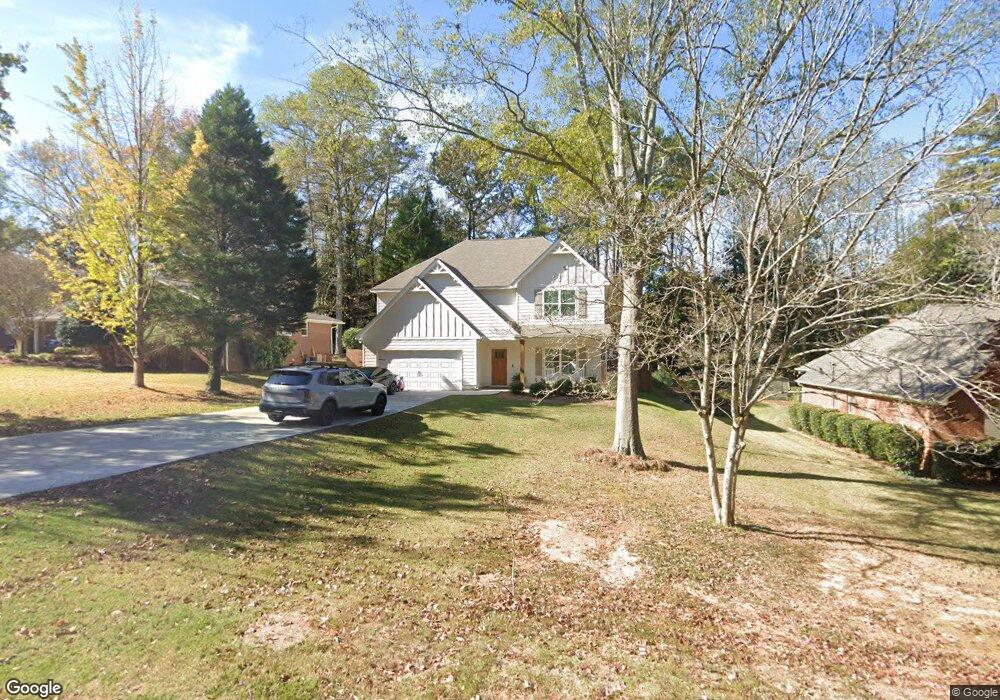
507 Pineview Terrace Lagrange, GA 30240
Estimated Value: $380,316 - $432,000
4
Beds
3
Baths
2,655
Sq Ft
$154/Sq Ft
Est. Value
About This Home
This home is located at 507 Pineview Terrace, Lagrange, GA 30240 and is currently estimated at $407,579, approximately $153 per square foot. 507 Pineview Terrace is a home located in Troup County with nearby schools including Hollis Hand Elementary School, Ethel W. Kight Elementary School, and Franklin Forest Elementary School.
Ownership History
Date
Name
Owned For
Owner Type
Purchase Details
Closed on
May 13, 2024
Sold by
Brown Alexander
Bought by
Howard Ellen Doerr and Howard Jacob Lee
Current Estimated Value
Purchase Details
Closed on
Aug 7, 2019
Sold by
Trademark Quality Homes Inc
Bought by
Brown Alexander
Home Financials for this Owner
Home Financials are based on the most recent Mortgage that was taken out on this home.
Original Mortgage
$292,307
Interest Rate
3.7%
Mortgage Type
New Conventional
Purchase Details
Closed on
Aug 26, 2004
Sold by
William H Watts
Bought by
Watts Timothy Howard As Truste
Purchase Details
Closed on
Jul 31, 1990
Sold by
Cates John W and Cates Mary A
Bought by
William H Watts
Purchase Details
Closed on
Jul 20, 1990
Sold by
John Gibson Freeman
Bought by
Cates John W and Cates Mary A
Purchase Details
Closed on
Jan 1, 1959
Sold by
Raymond Fred and Raymond Jabaley
Bought by
John Gibson Freeman
Create a Home Valuation Report for This Property
The Home Valuation Report is an in-depth analysis detailing your home's value as well as a comparison with similar homes in the area
Purchase History
| Date | Buyer | Sale Price | Title Company |
|---|---|---|---|
| Howard Ellen Doerr | $375,000 | -- | |
| Brown Alexander | $299,914 | -- | |
| Watts Timothy Howard As Truste | -- | -- | |
| William H Watts | $21,000 | -- | |
| Cates John W | -- | -- | |
| John Gibson Freeman | -- | -- |
Source: Public Records
Mortgage History
| Date | Status | Borrower | Loan Amount |
|---|---|---|---|
| Previous Owner | Brown Alexander | $292,307 |
Source: Public Records
Tax History
| Year | Tax Paid | Tax Assessment Tax Assessment Total Assessment is a certain percentage of the fair market value that is determined by local assessors to be the total taxable value of land and additions on the property. | Land | Improvement |
|---|---|---|---|---|
| 2025 | $3,869 | $150,000 | $18,000 | $132,000 |
| 2024 | $3,869 | $141,880 | $18,000 | $123,880 |
| 2023 | $3,629 | $133,080 | $18,000 | $115,080 |
| 2022 | $3,487 | $124,920 | $18,000 | $106,920 |
| 2021 | $3,618 | $119,960 | $18,000 | $101,960 |
| 2020 | $3,618 | $119,960 | $18,000 | $101,960 |
| 2019 | $239 | $7,920 | $7,920 | $0 |
| 2018 | $239 | $7,920 | $7,920 | $0 |
| 2017 | $241 | $7,988 | $7,988 | $0 |
| 2016 | $241 | $7,988 | $7,988 | $0 |
| 2015 | $241 | $7,988 | $7,988 | $0 |
| 2014 | $242 | $7,988 | $7,988 | $0 |
| 2013 | -- | $7,988 | $7,988 | $0 |
Source: Public Records
Map
Nearby Homes
- 705 Piney Woods Dr
- 910 Piney Woods Dr
- 216 E Lane Cir
- 203 Waverly Way
- 120 Saynor Cir
- 105 Saynor Cir
- 0 Hills and Dales Farm Rd
- 598 Edmondson Ave
- 222 Beechwood Cir
- 724 Camellia Dr
- 106 Ewing St
- 732 Camellia Dr
- 109 Thomas St
- 119 College Ave
- 0 N Lee St Unit 10550825
- 219 Banks St
- 203 S Chilton Crescent
- 217 Jefferson St
- 201 S Chilton Crescent
- 208 Boulevard
- 509 Pineview Terrace
- 505 Pineview Terrace
- 511 Pineview Terrace
- 503 Pineview Terrace
- 242 Westwood Dr
- 244 Westwood Dr
- 516 Pineview Terrace
- 238 Westwood Dr
- 246 Westwood Dr
- 500 Pineview Terrace
- 518 Pineview Terrace
- 603 Ridgecrest Rd
- 601 Ridgecrest Rd
- 501 Pineview Terrace
- 607 Ridgecrest Rd
- 232 Westwood Dr
- 513 Ridgecrest Rd
- 529 Ridgecrest Rd
- 515 Ridgecrest Rd
- 239 Westwood Dr
Your Personal Tour Guide
Ask me questions while you tour the home.