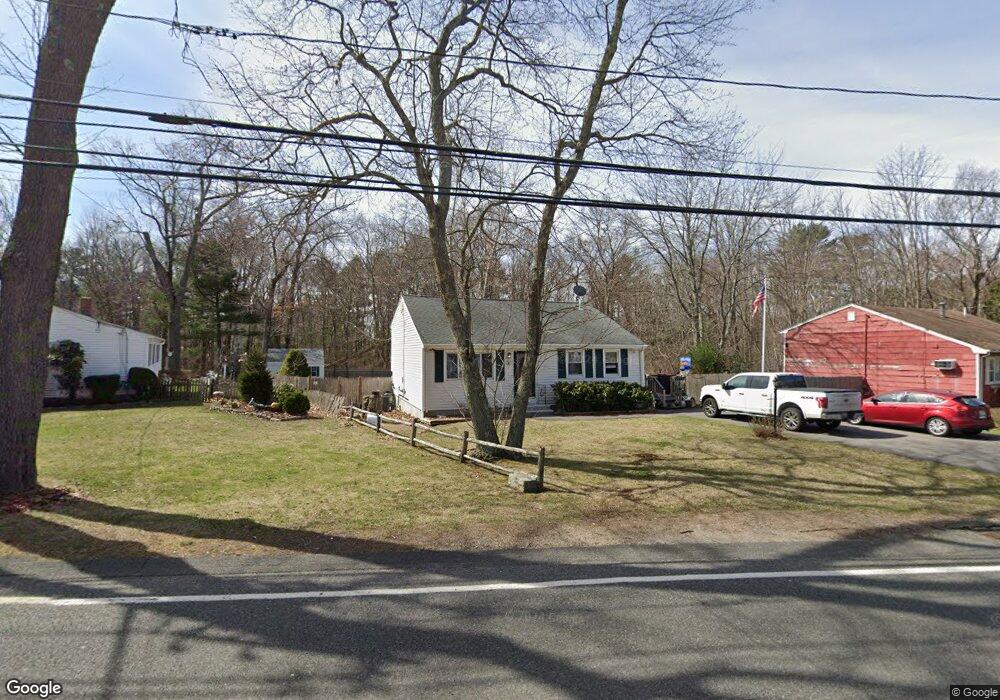
507 Plain St Brockton, MA 02302
Estimated Value: $477,000 - $541,000
3
Beds
2
Baths
1,360
Sq Ft
$367/Sq Ft
Est. Value
About This Home
This home is located at 507 Plain St, Brockton, MA 02302 and is currently estimated at $499,210, approximately $367 per square foot. 507 Plain St is a home located in Plymouth County with nearby schools including Gilmore Elementary School, Davis K-8 School, and John F. Kennedy Elementary School.
Ownership History
Date
Name
Owned For
Owner Type
Purchase Details
Closed on
Nov 1, 2021
Sold by
Probst Barry L and Probst Patricia E
Bought by
Probst F Amily Ret
Current Estimated Value
Purchase Details
Closed on
May 3, 1988
Sold by
Fortini Russell
Bought by
Probst Barry L
Create a Home Valuation Report for This Property
The Home Valuation Report is an in-depth analysis detailing your home's value as well as a comparison with similar homes in the area
Purchase History
| Date | Buyer | Sale Price | Title Company |
|---|---|---|---|
| Probst F Amily Ret | -- | None Available | |
| Probst Barry L | $138,900 | -- |
Source: Public Records
Mortgage History
| Date | Status | Borrower | Loan Amount |
|---|---|---|---|
| Previous Owner | Probst Barry L | $181,295 | |
| Previous Owner | Probst Barry L | $191,290 | |
| Previous Owner | Probst Barry L | $20,000 | |
| Previous Owner | Probst Barry L | $137,500 |
Source: Public Records
Tax History
| Year | Tax Paid | Tax Assessment Tax Assessment Total Assessment is a certain percentage of the fair market value that is determined by local assessors to be the total taxable value of land and additions on the property. | Land | Improvement |
|---|---|---|---|---|
| 2025 | $5,238 | $432,500 | $175,100 | $257,400 |
| 2024 | $4,990 | $415,100 | $175,100 | $240,000 |
| 2023 | $4,864 | $374,700 | $127,500 | $247,200 |
| 2022 | $4,843 | $346,700 | $115,900 | $230,800 |
| 2021 | $4,322 | $298,100 | $104,100 | $194,000 |
| 2020 | $4,203 | $277,400 | $90,800 | $186,600 |
| 2019 | $4,191 | $269,700 | $86,900 | $182,800 |
| 2018 | $3,790 | $236,000 | $86,900 | $149,100 |
| 2017 | $3,632 | $225,600 | $86,900 | $138,700 |
| 2016 | $3,411 | $196,500 | $83,200 | $113,300 |
| 2015 | $3,185 | $175,500 | $83,200 | $92,300 |
| 2014 | $3,214 | $177,300 | $83,200 | $94,100 |
Source: Public Records
Map
Nearby Homes
- 578 Plain St
- 23 Dondi Rd
- 118 Deanna Rd
- 1 Thomas Cir
- 15 Wachusetts Rd
- 12 Paulin Ave
- 463 Pleasant St
- 31 Friendship Dr
- 16 Liberty St
- 16 Jason Way
- 549 Summer St
- 18 American Ave
- 9 Longworth Ave Unit 135
- 9 Longworth Ave Unit 113
- 15 Longworth Ave Unit 226
- 25 Longworth Ave Unit 4
- 10 Colleen Way
- 35 Longworth Ave Unit 25
- 111 Riverview St
- 55 Marjan Dr
Your Personal Tour Guide
Ask me questions while you tour the home.