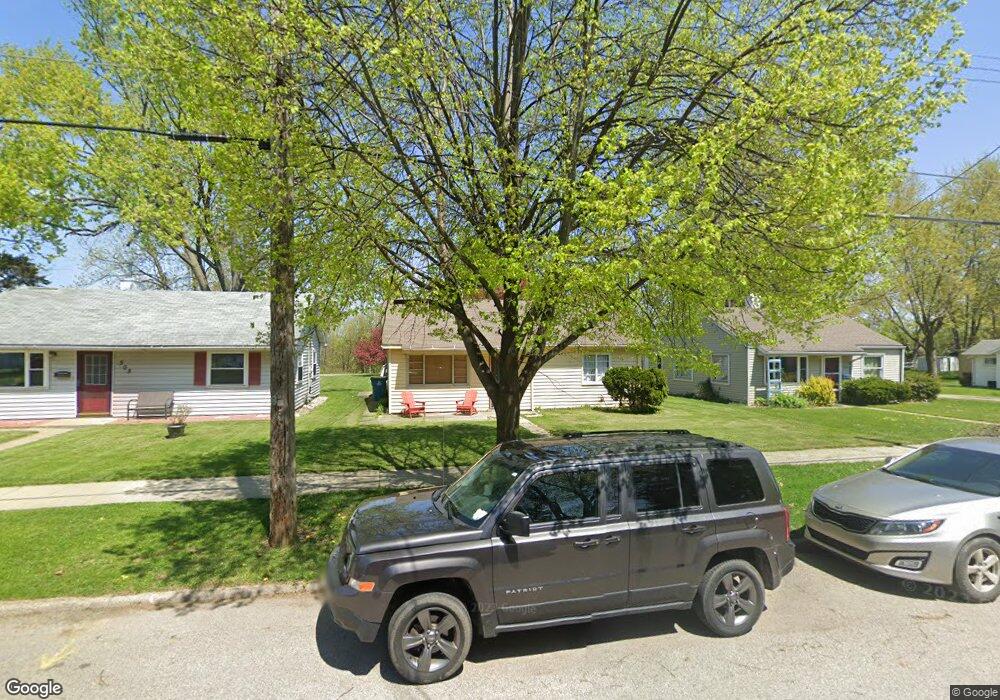
507 Randolph St Angola, IN 46703
Estimated Value: $127,000 - $145,000
2
Beds
1
Bath
762
Sq Ft
$181/Sq Ft
Est. Value
About This Home
This home is located at 507 Randolph St, Angola, IN 46703 and is currently estimated at $137,587, approximately $180 per square foot. 507 Randolph St is a home located in Steuben County with nearby schools including Angola High School and Grace Baptist Academy.
Ownership History
Date
Name
Owned For
Owner Type
Purchase Details
Closed on
Dec 2, 2024
Sold by
Knauer Roger C and Knauer Deborah D
Bought by
Spence Jakob
Current Estimated Value
Purchase Details
Closed on
Jun 22, 2015
Sold by
Knauer Deborah D and Knauer Roger C
Bought by
Bundy Gail M
Home Financials for this Owner
Home Financials are based on the most recent Mortgage that was taken out on this home.
Original Mortgage
$40,000
Interest Rate
3.97%
Mortgage Type
Land Contract Argmt. Of Sale
Purchase Details
Closed on
Jun 9, 2005
Sold by
Zook Paul D and Zook Carol A
Bought by
Hill Country Enterprises Inc
Purchase Details
Closed on
Apr 20, 2005
Sold by
Secretary Of Hud Of Washington Dc
Bought by
Zook Paul D and Zook Carol A
Purchase Details
Closed on
Jul 8, 1998
Sold by
Golden Dorothy M
Bought by
Romine Stephen P
Purchase Details
Closed on
Jul 16, 1997
Sold by
Beattie Roger T and Beattie Norma T
Bought by
Golden Dorothy M
Create a Home Valuation Report for This Property
The Home Valuation Report is an in-depth analysis detailing your home's value as well as a comparison with similar homes in the area
Home Values in the Area
Average Home Value in this Area
Purchase History
| Date | Buyer | Sale Price | Title Company |
|---|---|---|---|
| Spence Jakob | $10,000 | -- | |
| Bundy Gail M | $40,000 | None Available | |
| Hill Country Enterprises Inc | -- | None Available | |
| Zook Paul D | -- | None Available | |
| Romine Stephen P | $55,000 | -- | |
| Golden Dorothy M | $62,000 | -- |
Source: Public Records
Mortgage History
| Date | Status | Borrower | Loan Amount |
|---|---|---|---|
| Previous Owner | Bundy Gail M | $40,000 |
Source: Public Records
Tax History Compared to Growth
Tax History
| Year | Tax Paid | Tax Assessment Tax Assessment Total Assessment is a certain percentage of the fair market value that is determined by local assessors to be the total taxable value of land and additions on the property. | Land | Improvement |
|---|---|---|---|---|
| 2024 | $1,193 | $64,600 | $16,800 | $47,800 |
| 2023 | $1,206 | $65,100 | $16,800 | $48,300 |
| 2022 | $15 | $59,100 | $15,000 | $44,100 |
| 2021 | $0 | $49,500 | $13,400 | $36,100 |
| 2020 | $15 | $49,500 | $13,400 | $36,100 |
| 2019 | $15 | $39,200 | $13,400 | $25,800 |
| 2018 | $15 | $38,300 | $13,400 | $24,900 |
| 2017 | $15 | $35,900 | $13,400 | $22,500 |
| 2016 | $15 | $31,900 | $13,400 | $18,500 |
| 2014 | $624 | $31,200 | $13,400 | $17,800 |
| 2013 | $624 | $31,400 | $13,400 | $18,000 |
Source: Public Records
Map
Nearby Homes
- 700 Apple Hill Way
- 814 Apple Hill Way
- 308 E Broad St
- 600 E Maumee St
- 308 Clyde Ave
- 109 E Broad St
- 941 E Maumee St
- TBD U S 20
- 406 S Wayne St
- 902 Mechanic St
- 513 S Wayne St
- 311 S Superior St
- 405 Hilltop Dr
- 312 W Pleasant St
- 107 W Felicity St
- 1003 Crestview Dr
- 1105 Redding Ln
- 530 E 20 N
- 707 Bluffview Dr
- 1311 Shire Dr
- 505 Randolph St
- 509 Randolph St
- 503 Randolph St
- 603 Randolph St
- 504 Carlin Dr
- 605 Randolph St
- 508 Randolph St
- 506 Randolph St
- 600 Randolph St
- 504 Randolph St
- 412 Williams St
- 606 Carlin Dr
- 607 Randolph St
- 414 Williams St
- 606 Randolph St
- 609 Randolph St
- 608 Carlin Dr
- 608 Randolph St
- 519 E Broad St
- 515 E Broad St