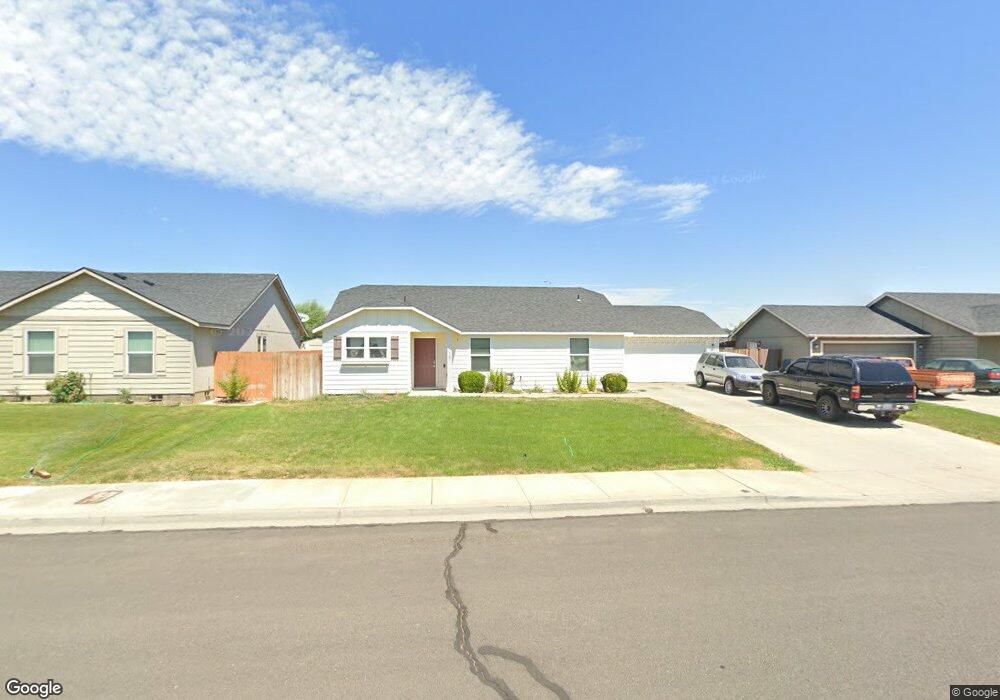
507 S St SW Quincy, WA 98848
Estimated Value: $321,722 - $391,000
3
Beds
2
Baths
1,244
Sq Ft
$291/Sq Ft
Est. Value
About This Home
This home is located at 507 S St SW, Quincy, WA 98848 and is currently estimated at $361,681, approximately $290 per square foot. 507 S St SW is a home with nearby schools including Pioneer Elementary School, Monument Elementary School, and Quincy Middle School.
Ownership History
Date
Name
Owned For
Owner Type
Purchase Details
Closed on
Oct 8, 2008
Sold by
W A F A
Bought by
Arreola Jose A
Current Estimated Value
Home Financials for this Owner
Home Financials are based on the most recent Mortgage that was taken out on this home.
Original Mortgage
$101,600
Outstanding Balance
$67,171
Interest Rate
6.31%
Mortgage Type
Purchase Money Mortgage
Estimated Equity
$294,510
Purchase Details
Closed on
Jul 10, 2008
Sold by
Hayden Homes Llc
Bought by
Washington Agricultural Families Assista
Create a Home Valuation Report for This Property
The Home Valuation Report is an in-depth analysis detailing your home's value as well as a comparison with similar homes in the area
Home Values in the Area
Average Home Value in this Area
Purchase History
| Date | Buyer | Sale Price | Title Company |
|---|---|---|---|
| Arreola Jose A | $127,000 | Chicago Title | |
| Washington Agricultural Families Assista | $220,000 | Chicago Title Ins Co |
Source: Public Records
Mortgage History
| Date | Status | Borrower | Loan Amount |
|---|---|---|---|
| Open | Arreola Jose A | $101,600 |
Source: Public Records
Tax History Compared to Growth
Tax History
| Year | Tax Paid | Tax Assessment Tax Assessment Total Assessment is a certain percentage of the fair market value that is determined by local assessors to be the total taxable value of land and additions on the property. | Land | Improvement |
|---|---|---|---|---|
| 2024 | $1,836 | $224,112 | $46,000 | $178,112 |
| 2023 | $1,749 | $194,740 | $46,000 | $148,740 |
| 2022 | $1,711 | $194,740 | $46,000 | $148,740 |
| 2021 | $1,411 | $194,740 | $46,000 | $148,740 |
| 2020 | $1,339 | $143,885 | $24,000 | $119,885 |
| 2019 | $1,275 | $126,760 | $24,000 | $102,760 |
| 2018 | $1,401 | $123,960 | $24,000 | $99,960 |
| 2017 | $1,382 | $121,785 | $24,000 | $97,785 |
| 2016 | $1,231 | $123,100 | $24,000 | $99,100 |
| 2013 | -- | $119,685 | $24,500 | $95,185 |
Source: Public Records
Map
Nearby Homes