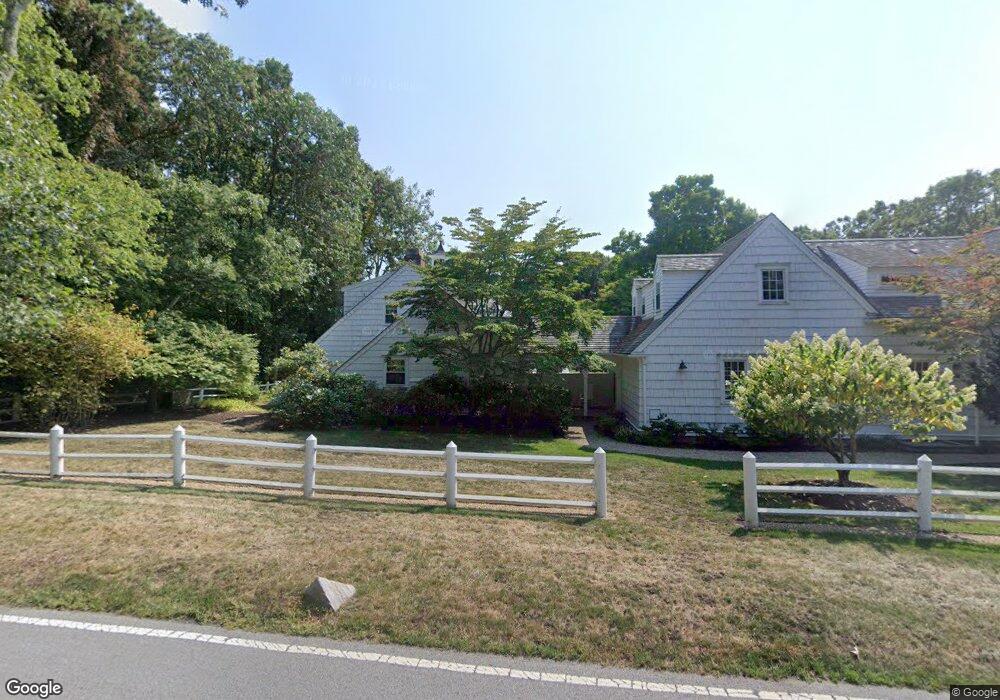
507 Sea View Ave Osterville, MA 02655
Osterville NeighborhoodEstimated Value: $3,575,000 - $5,839,000
3
Beds
3
Baths
4,911
Sq Ft
$966/Sq Ft
Est. Value
About This Home
This home is located at 507 Sea View Ave, Osterville, MA 02655 and is currently estimated at $4,742,034, approximately $965 per square foot. 507 Sea View Ave is a home located in Barnstable County with nearby schools including West Villages Elementary School, Barnstable United Elementary School, and Barnstable Intermediate School.
Ownership History
Date
Name
Owned For
Owner Type
Purchase Details
Closed on
Sep 16, 2009
Sold by
Corcoran-Miller Constance
Bought by
Constance C Miller T
Current Estimated Value
Purchase Details
Closed on
Apr 17, 1992
Sold by
Boston Five Cents Sb
Bought by
Miller J Sanford
Purchase Details
Closed on
Nov 19, 1991
Sold by
Ahearn Kevin J
Bought by
Boston Five Cents Sb
Purchase Details
Closed on
Sep 20, 1988
Sold by
Cotuit Bay T
Bought by
Ahearn Kevin J
Home Financials for this Owner
Home Financials are based on the most recent Mortgage that was taken out on this home.
Original Mortgage
$930,000
Interest Rate
10.43%
Mortgage Type
Purchase Money Mortgage
Purchase Details
Closed on
Apr 11, 1988
Sold by
Pieper Charles P
Bought by
Shields Robert M
Home Financials for this Owner
Home Financials are based on the most recent Mortgage that was taken out on this home.
Original Mortgage
$900,000
Interest Rate
9.89%
Mortgage Type
Purchase Money Mortgage
Create a Home Valuation Report for This Property
The Home Valuation Report is an in-depth analysis detailing your home's value as well as a comparison with similar homes in the area
Home Values in the Area
Average Home Value in this Area
Purchase History
| Date | Buyer | Sale Price | Title Company |
|---|---|---|---|
| Constance C Miller T | -- | -- | |
| Miller J Sanford | $550,000 | -- | |
| Boston Five Cents Sb | $595,000 | -- | |
| Ahearn Kevin J | $1,150,000 | -- | |
| Shields Robert M | $1,000,000 | -- |
Source: Public Records
Mortgage History
| Date | Status | Borrower | Loan Amount |
|---|---|---|---|
| Previous Owner | Shields Robert M | $930,000 | |
| Previous Owner | Shields Robert M | $900,000 |
Source: Public Records
Tax History Compared to Growth
Tax History
| Year | Tax Paid | Tax Assessment Tax Assessment Total Assessment is a certain percentage of the fair market value that is determined by local assessors to be the total taxable value of land and additions on the property. | Land | Improvement |
|---|---|---|---|---|
| 2025 | $32,030 | $3,959,200 | $2,116,100 | $1,843,100 |
| 2024 | $30,208 | $3,867,800 | $2,116,100 | $1,751,700 |
| 2023 | $35,593 | $4,267,800 | $2,725,300 | $1,542,500 |
| 2022 | $25,784 | $2,674,700 | $1,395,300 | $1,279,400 |
| 2021 | $25,935 | $2,472,400 | $1,395,300 | $1,077,100 |
| 2020 | $26,594 | $2,426,500 | $1,395,300 | $1,031,200 |
| 2019 | $26,174 | $2,320,400 | $1,448,800 | $871,600 |
| 2018 | $25,541 | $2,276,400 | $1,525,000 | $751,400 |
| 2017 | $22,011 | $2,045,600 | $1,525,000 | $520,600 |
| 2016 | $18,898 | $1,733,800 | $1,525,000 | $208,800 |
| 2015 | $19,035 | $1,754,400 | $1,512,800 | $241,600 |
Source: Public Records
Map
Nearby Homes
- 439 Sea View Ave
- 501 Eel River Rd
- 391 Sea View Ave
- 414 Eel River Rd
- 168 Garrison Ln
- 51 Wianno Cir
- 850 Sea View Ave
- 255 Bayberry Way
- 199 E Bay Rd Unit 13
- 16 2nd Ave Unit 5A
- 64 Bay St
- 14 Indian Trail
- 39 Tower Hill Rd Unit 1C
- 920 Main St Unit 1 Building 2
- 920 Main St Unit 2-1
- 123 Tower Hill Rd
- 77 Robbins St
- 520 Sea View Ave
- 801 Sea View Ave
- 0 Sea View Ave
- 520 Sea View Ave
- 537 Sea View Ave
- 539 Sea View Ave
- 469 Sea View Ave
- 560 Sea View Ave
- 550 Parker Rd
- 489 Sea View Ave
- 567 Sea View Ave
- 511 Sea View Ave
- 585 Parker Rd
- 543 Sea View Ave
- 447 Sea View Ave
- 459 Sea View Ave
- 571 Sea View Ave
- 541 Sea View Ave
- 81 Leonard Rd
- 570 Sea View Ave