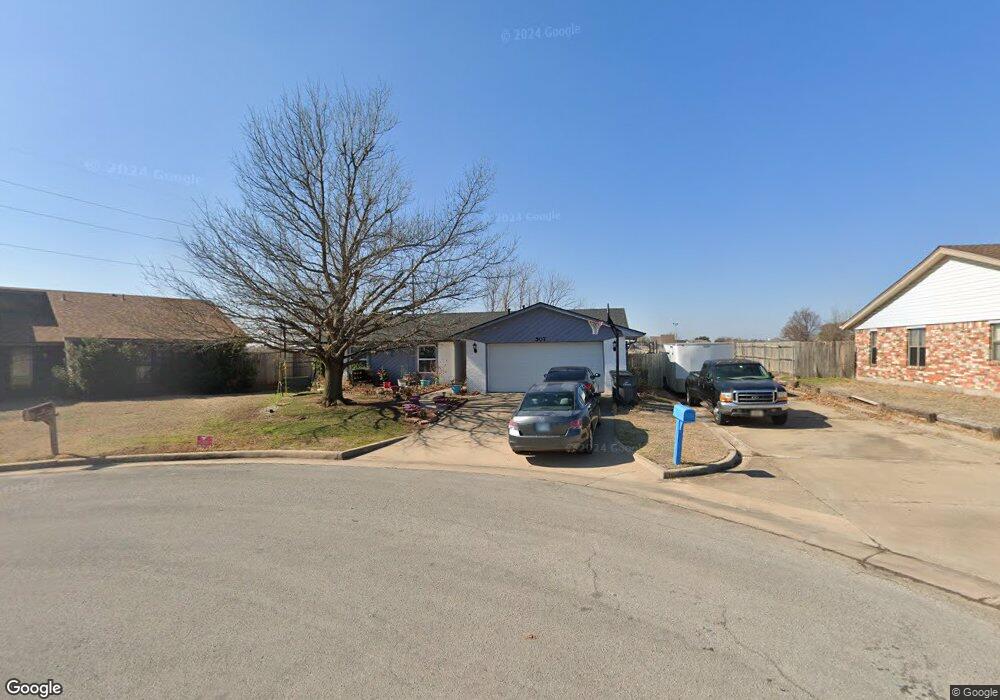
507 SW 77th St Lawton, OK 73505
Estimated Value: $165,274 - $185,000
3
Beds
2
Baths
1,500
Sq Ft
$117/Sq Ft
Est. Value
About This Home
This home is located at 507 SW 77th St, Lawton, OK 73505 and is currently estimated at $175,819, approximately $117 per square foot. 507 SW 77th St is a home located in Comanche County with nearby schools including Almor West Elementary School, Eisenhower Middle School, and Eisenhower High School.
Ownership History
Date
Name
Owned For
Owner Type
Purchase Details
Closed on
Apr 30, 2011
Sold by
Kemp Morgan H and Kemp Elizabeth A
Bought by
Cossette Josh and Cossette Elizabeth
Current Estimated Value
Home Financials for this Owner
Home Financials are based on the most recent Mortgage that was taken out on this home.
Original Mortgage
$107,211
Outstanding Balance
$73,793
Interest Rate
4.75%
Mortgage Type
FHA
Estimated Equity
$102,026
Purchase Details
Closed on
Oct 7, 2006
Sold by
Kunz Glen Allen and Kunz Glen A
Bought by
Kemop Morgan H and Kemop Elizabeth A
Home Financials for this Owner
Home Financials are based on the most recent Mortgage that was taken out on this home.
Original Mortgage
$120,537
Interest Rate
6.41%
Mortgage Type
VA
Purchase Details
Closed on
Feb 17, 1998
Sold by
Hagler Kent
Purchase Details
Closed on
Jul 22, 1993
Sold by
Naberhaus John A and Naberhaus Holly~J
Purchase Details
Closed on
Aug 28, 1992
Sold by
Abla Kirby D and Abla Christie~Raye
Create a Home Valuation Report for This Property
The Home Valuation Report is an in-depth analysis detailing your home's value as well as a comparison with similar homes in the area
Home Values in the Area
Average Home Value in this Area
Purchase History
| Date | Buyer | Sale Price | Title Company |
|---|---|---|---|
| Cossette Josh | $110,000 | -- | |
| Kemop Morgan H | $118,000 | -- | |
| -- | $85,000 | -- | |
| -- | $75,000 | -- | |
| -- | -- | -- |
Source: Public Records
Mortgage History
| Date | Status | Borrower | Loan Amount |
|---|---|---|---|
| Open | Cossette Josh | $107,211 | |
| Previous Owner | Kemop Morgan H | $120,537 |
Source: Public Records
Tax History Compared to Growth
Tax History
| Year | Tax Paid | Tax Assessment Tax Assessment Total Assessment is a certain percentage of the fair market value that is determined by local assessors to be the total taxable value of land and additions on the property. | Land | Improvement |
|---|---|---|---|---|
| 2025 | $1,319 | $13,582 | $2,396 | $11,186 |
| 2024 | $1,319 | $13,582 | $2,404 | $11,178 |
| 2023 | $1,319 | $12,802 | $2,250 | $10,552 |
| 2022 | $1,258 | $12,802 | $2,250 | $10,552 |
| 2021 | $1,254 | $13,259 | $2,250 | $11,009 |
| 2020 | $1,220 | $13,001 | $2,250 | $10,751 |
| 2019 | $1,212 | $13,001 | $2,250 | $10,751 |
| 2018 | $1,233 | $13,380 | $2,243 | $11,137 |
| 2017 | $1,026 | $12,990 | $1,961 | $11,029 |
| 2016 | $1,021 | $12,613 | $1,688 | $10,925 |
| 2015 | $1,038 | $12,613 | $1,688 | $10,925 |
| 2014 | $1,028 | $12,613 | $1,688 | $10,925 |
Source: Public Records
Map
Nearby Homes
- 7708 SW Delta Ave
- 7606 SW Cherokee Ave
- 401 SW 78th St
- 220 SW 76th St
- 7502 SW Forest Ave
- 402 SW 79th St
- 419 SW 79th St
- 427 SW 80th St
- 304 SW 72nd St
- 111 SW 75th St
- 341 SW 71st St
- 6767 SW Chaucer Dr
- 404 SW 71st St
- 510 SW 70th St
- 6913 SW Delta Ave
- 6914 SW Forest Ave
- 8312 SW Fitzroy Place
- 6929 SW Hampshire Cir
- 6919 SW Hampshire Cir
- 205 NW 74th St
- 7520 SW Forest Ave
- 505 SW 77th St
- 503 SW 77th St
- 7516 SW Forest Ave
- 7511 SW Forest Ave
- 501 SW 77th St
- 7514 SW Forest Ave
- 7509 SW Forest Ave
- 7512 SW Delta Ave
- 7706 SW Delta Ave
- 7512 SW Forest Ave
- 7507 SW Forest Ave
- 7510 SW Forest Ave
- 7508 SW Delta Ave
- 7607 SW Delta Ave
- 7609 SW Delta Ave
- 7605 SW Delta Ave
- 7611 SW Delta Ave
- 7505 SW Forest Ave
- 7710 SW Delta Ave