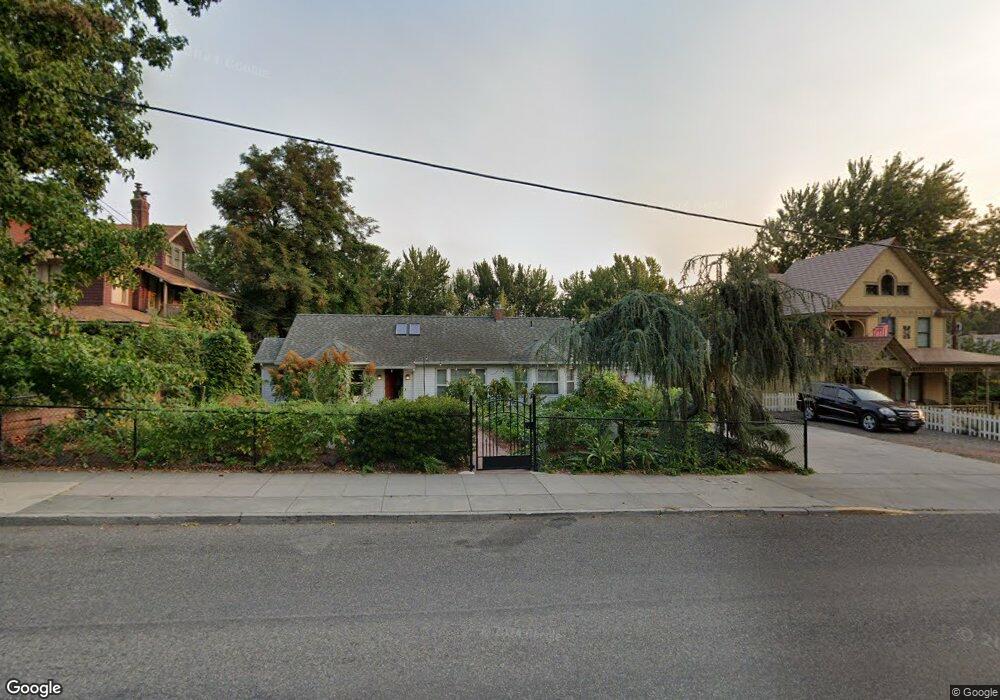
507 W 3rd Place the Dalles, OR 97058
Estimated Value: $634,241
3
Beds
5
Baths
3,692
Sq Ft
$172/Sq Ft
Est. Value
About This Home
This home is located at 507 W 3rd Place, the Dalles, OR 97058 and is currently estimated at $634,241, approximately $171 per square foot. 507 W 3rd Place is a home located in Wasco County with nearby schools including Colonel Wright Elementary School, The Dalles Middle School, and The Dalles High School.
Ownership History
Date
Name
Owned For
Owner Type
Purchase Details
Closed on
Oct 15, 2008
Sold by
Consumer Solutions Reo Llc
Bought by
Drew Martin Lee and Drew Stephanie Ann
Current Estimated Value
Home Financials for this Owner
Home Financials are based on the most recent Mortgage that was taken out on this home.
Original Mortgage
$223,920
Outstanding Balance
$145,061
Interest Rate
5.9%
Mortgage Type
New Conventional
Estimated Equity
$489,180
Purchase Details
Closed on
Sep 19, 2005
Sold by
Ray Francis Clifford R and Ray Francis Clifford
Bought by
Banta Randall C and Schunk Kelly J
Home Financials for this Owner
Home Financials are based on the most recent Mortgage that was taken out on this home.
Original Mortgage
$349,200
Interest Rate
5.81%
Mortgage Type
New Conventional
Create a Home Valuation Report for This Property
The Home Valuation Report is an in-depth analysis detailing your home's value as well as a comparison with similar homes in the area
Home Values in the Area
Average Home Value in this Area
Purchase History
| Date | Buyer | Sale Price | Title Company |
|---|---|---|---|
| Drew Martin Lee | $279,900 | -- | |
| Banta Randall C | $436,500 | -- |
Source: Public Records
Mortgage History
| Date | Status | Borrower | Loan Amount |
|---|---|---|---|
| Open | Drew Martin Lee | $223,920 | |
| Previous Owner | Banta Randall C | $349,200 |
Source: Public Records
Tax History Compared to Growth
Tax History
| Year | Tax Paid | Tax Assessment Tax Assessment Total Assessment is a certain percentage of the fair market value that is determined by local assessors to be the total taxable value of land and additions on the property. | Land | Improvement |
|---|---|---|---|---|
| 2024 | $6,167 | $342,637 | -- | -- |
| 2023 | $5,988 | $332,658 | $0 | $0 |
| 2022 | $5,854 | $118,397 | $0 | $0 |
| 2021 | $5,675 | $114,949 | $0 | $0 |
| 2020 | $5,535 | $111,601 | $0 | $0 |
| 2019 | $5,845 | $108,350 | $0 | $0 |
| 2018 | $5,682 | $286,953 | $0 | $0 |
| 2017 | $5,503 | $278,595 | $0 | $0 |
| 2016 | $5,384 | $270,481 | $0 | $0 |
| 2015 | $5,293 | $262,603 | $0 | $0 |
| 2014 | $5,144 | $254,954 | $0 | $0 |
Source: Public Records
Map
Nearby Homes