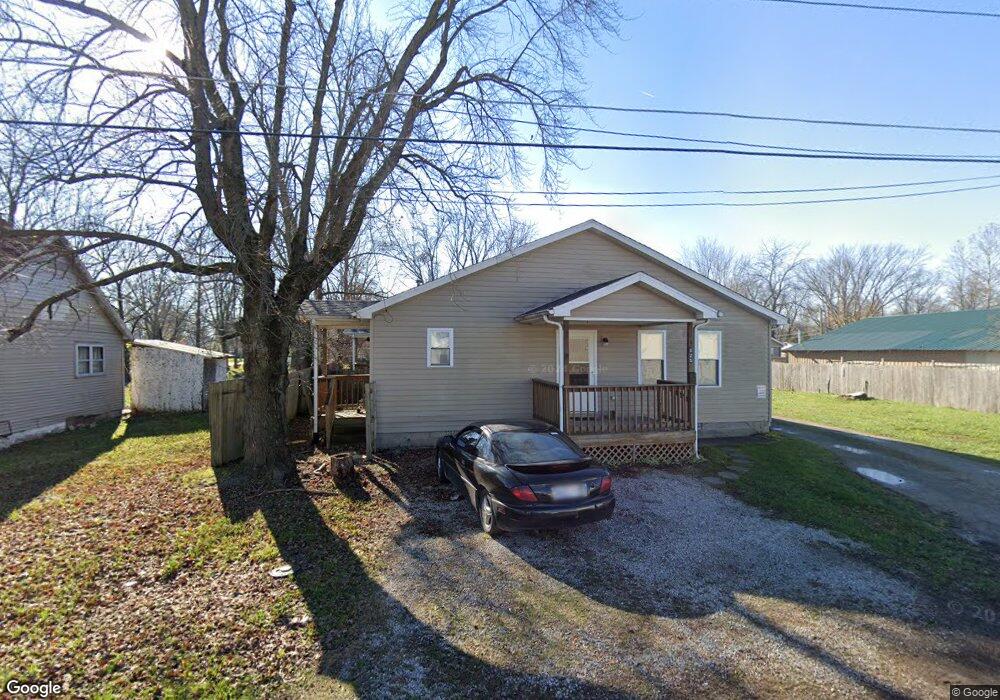
507 W Cherry St Austin, IN 47102
Estimated Value: $139,000 - $216,000
4
Beds
1
Bath
2,160
Sq Ft
$88/Sq Ft
Est. Value
About This Home
This home is located at 507 W Cherry St, Austin, IN 47102 and is currently estimated at $190,978, approximately $88 per square foot. 507 W Cherry St is a home located in Scott County with nearby schools including Austin Elementary School, Austin Middle School, and Austin High School.
Ownership History
Date
Name
Owned For
Owner Type
Purchase Details
Closed on
Jun 23, 2023
Sold by
Knobstone Development Group Inc
Bought by
Nova Horizons Llc
Current Estimated Value
Purchase Details
Closed on
Nov 6, 2019
Sold by
James Clinton and James Carrie
Bought by
Knobstone Development Group Inc
Purchase Details
Closed on
Aug 30, 2019
Sold by
Fugate Sonny and Fugate Wanda M
Bought by
James Clinton and James Carrie
Home Financials for this Owner
Home Financials are based on the most recent Mortgage that was taken out on this home.
Original Mortgage
$44,000
Interest Rate
3.7%
Mortgage Type
Commercial
Purchase Details
Closed on
Sep 8, 2017
Sold by
Watkins James Arthur
Bought by
Fugate Sonny and Fugate Wanda M
Purchase Details
Closed on
Sep 12, 2016
Sold by
Watkins George
Bought by
Watkins James Arthur
Create a Home Valuation Report for This Property
The Home Valuation Report is an in-depth analysis detailing your home's value as well as a comparison with similar homes in the area
Home Values in the Area
Average Home Value in this Area
Purchase History
| Date | Buyer | Sale Price | Title Company |
|---|---|---|---|
| Nova Horizons Llc | $260,000 | Nova Horizons Llc | |
| Knobstone Development Group Inc | -- | Louisville Title Agency | |
| James Clinton | -- | Signature Title Llc | |
| Fugate Sonny | -- | None Available | |
| Watkins James Arthur | -- | None Available |
Source: Public Records
Mortgage History
| Date | Status | Borrower | Loan Amount |
|---|---|---|---|
| Previous Owner | James Clinton | $44,000 |
Source: Public Records
Tax History
| Year | Tax Paid | Tax Assessment Tax Assessment Total Assessment is a certain percentage of the fair market value that is determined by local assessors to be the total taxable value of land and additions on the property. | Land | Improvement |
|---|---|---|---|---|
| 2025 | $2,266 | $118,500 | $7,700 | $110,800 |
| 2024 | $2,266 | $92,400 | $7,700 | $84,700 |
| 2023 | $2,494 | $94,300 | $7,700 | $86,600 |
| 2022 | $2,574 | $116,600 | $7,700 | $108,900 |
| 2021 | $2,442 | $117,900 | $7,700 | $110,200 |
| 2020 | $2,388 | $119,400 | $7,700 | $111,700 |
| 2019 | $2,474 | $123,700 | $7,700 | $116,000 |
| 2018 | $2,486 | $124,300 | $7,700 | $116,600 |
| 2017 | $2,512 | $125,600 | $7,700 | $117,900 |
| 2016 | $2,548 | $127,400 | $7,700 | $119,700 |
| 2014 | $2,813 | $140,200 | $7,700 | $132,500 |
| 2013 | $2,813 | $98,700 | $7,700 | $91,000 |
Source: Public Records
Map
Nearby Homes
Your Personal Tour Guide
Ask me questions while you tour the home.