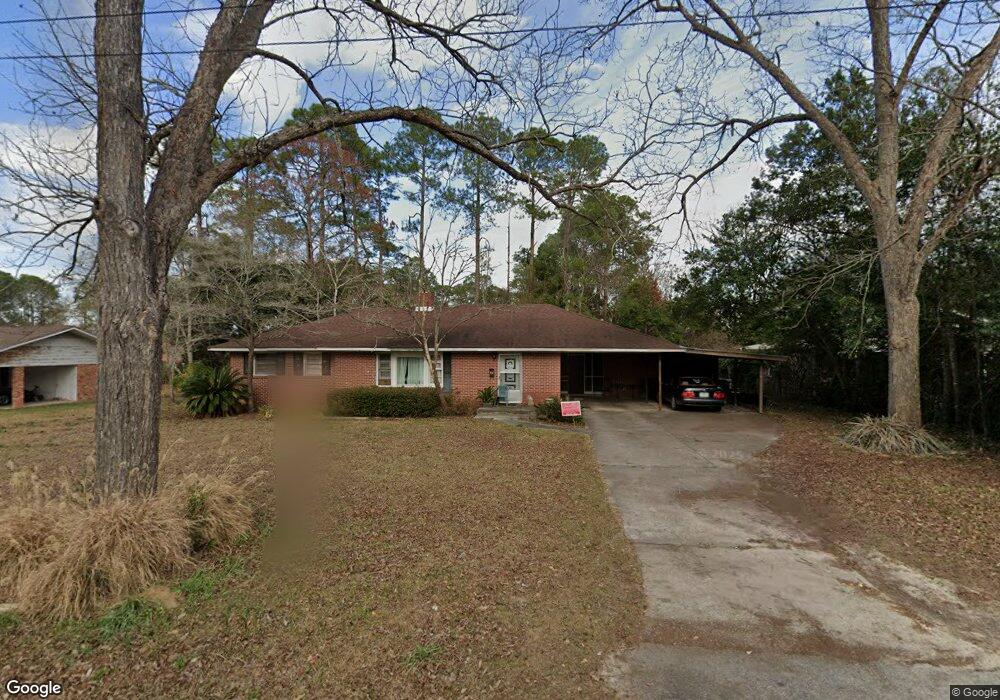
507 W Dennis Ave Nashville, GA 31639
Estimated Value: $73,798 - $137,000
5
Beds
1
Bath
1,533
Sq Ft
$75/Sq Ft
Est. Value
About This Home
This home is located at 507 W Dennis Ave, Nashville, GA 31639 and is currently estimated at $114,450, approximately $74 per square foot. 507 W Dennis Ave is a home located in Berrien County with nearby schools including Berrien Primary School, Berrien Elementary School, and Berrien Middle School.
Ownership History
Date
Name
Owned For
Owner Type
Purchase Details
Closed on
Jun 5, 2014
Sold by
Griner Rhond S
Bought by
Griner Rhonda S and Moran Kristie
Current Estimated Value
Purchase Details
Closed on
Oct 24, 2013
Sold by
Griner Rhonda S
Bought by
Griner Rhonda S and Griner James Charleen
Purchase Details
Closed on
Feb 13, 2004
Sold by
Griner Mary Ruth
Bought by
Griner Jerry Lawton
Create a Home Valuation Report for This Property
The Home Valuation Report is an in-depth analysis detailing your home's value as well as a comparison with similar homes in the area
Home Values in the Area
Average Home Value in this Area
Purchase History
| Date | Buyer | Sale Price | Title Company |
|---|---|---|---|
| Griner Rhonda S | -- | -- | |
| Griner Rhonda S | -- | -- | |
| Griner Jerry Lawton | -- | -- |
Source: Public Records
Tax History Compared to Growth
Tax History
| Year | Tax Paid | Tax Assessment Tax Assessment Total Assessment is a certain percentage of the fair market value that is determined by local assessors to be the total taxable value of land and additions on the property. | Land | Improvement |
|---|---|---|---|---|
| 2024 | $539 | $13,209 | $2,349 | $10,860 |
| 2023 | $541 | $13,209 | $2,349 | $10,860 |
| 2022 | $541 | $13,209 | $2,349 | $10,860 |
| 2021 | $418 | $13,209 | $2,349 | $10,860 |
| 2020 | $419 | $13,209 | $2,349 | $10,860 |
| 2019 | $419 | $13,209 | $2,349 | $10,860 |
| 2018 | $513 | $13,209 | $2,349 | $10,860 |
| 2017 | $419 | $13,209 | $2,349 | $10,860 |
| 2016 | $407 | $13,209 | $2,349 | $10,860 |
| 2015 | -- | $13,209 | $2,349 | $10,860 |
| 2014 | -- | $13,209 | $2,349 | $10,860 |
| 2013 | -- | $13,460 | $2,600 | $10,860 |
Source: Public Records
Map
Nearby Homes
- 307 Gaskins St
- 309 S Dogwood Dr
- 514 W Mcpherson Ave
- 612 W Dennis Ave
- 205 S Dogwood Dr Unit K
- 409 Abby St
- 624 W Washington Ave
- 602 S Berrien St
- 713 Pall Mall Place
- .73AC Davis St
- 102 W Avera Ave
- 805 S Berrien St
- 213 Chism Ave
- 208 N Bullard St Unit A/ B
- 301 Kirby Cir
- 201 Beetree Ave
- 205 Beetree Ave
- 203 Guest Cir
- 603 N Jackson St
- 501 Hull Ave
- 505 W Dennis Ave
- 511 W Dennis Ave
- 501 W Dennis Ave
- 510 W Dennis Ave
- 508 W Dennis Ave
- 311 S Dogwood Dr
- 512 W Dennis Ave
- 315 Gaskins St
- 315 Gaskins St
- 309 Gaskins St
- 309 Gaskins St
- 506 W Dennis Ave
- 401 S Dogwood Dr
- 403 Gaskins St
- 410 Gaskins St
- 407 W Dennis Ave
- 403 S Dogwood Dr
- 402 S Dogwood Dr
- 604 Boatwright Ave
- 603 W Dennis Ave