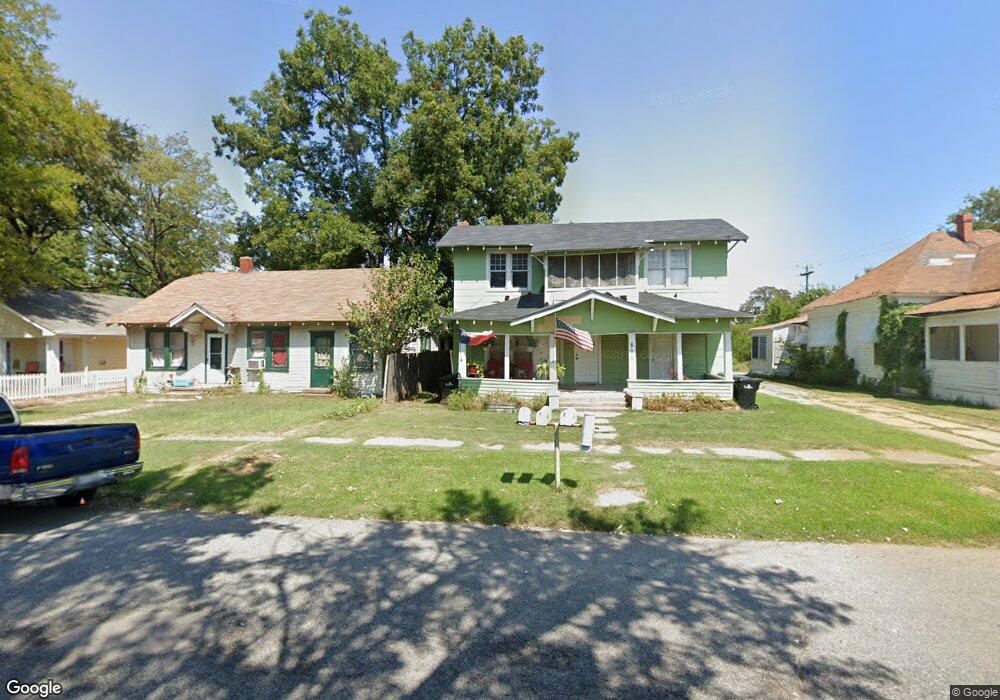
507 W Morgan St Unit 509 Denison, TX 75020
Estimated Value: $130,758 - $218,000
--
Bed
--
Bath
1,064
Sq Ft
$164/Sq Ft
Est. Value
About This Home
This home is located at 507 W Morgan St Unit 509, Denison, TX 75020 and is currently estimated at $174,379, approximately $163 per square foot. 507 W Morgan St Unit 509 is a home located in Grayson County with nearby schools including Terrell Elementary School, Scott Middle School, and Denison High School.
Ownership History
Date
Name
Owned For
Owner Type
Purchase Details
Closed on
Oct 24, 2024
Sold by
Liquori Properties Llc
Bought by
Smitty Enterprises Llc
Current Estimated Value
Home Financials for this Owner
Home Financials are based on the most recent Mortgage that was taken out on this home.
Original Mortgage
$125,480
Outstanding Balance
$124,123
Interest Rate
6.2%
Mortgage Type
New Conventional
Estimated Equity
$50,256
Purchase Details
Closed on
Apr 4, 2023
Sold by
Williams Ben
Bought by
Liquori Properties Llc
Purchase Details
Closed on
Mar 1, 2022
Sold by
Nathan Parks
Bought by
Williams Ben
Purchase Details
Closed on
Feb 28, 2022
Sold by
Nathan Parks
Bought by
Williams Ben
Purchase Details
Closed on
Mar 11, 2010
Sold by
Barron Alford Brien and Barron Carrie Jo
Bought by
Parks Nathan
Create a Home Valuation Report for This Property
The Home Valuation Report is an in-depth analysis detailing your home's value as well as a comparison with similar homes in the area
Home Values in the Area
Average Home Value in this Area
Purchase History
| Date | Buyer | Sale Price | Title Company |
|---|---|---|---|
| Smitty Enterprises Llc | -- | Red River Title | |
| Liquori Properties Llc | -- | Red River Title | |
| Williams Ben | -- | Red River Title | |
| Williams Ben | -- | Red River Title | |
| Parks Nathan | $18,000 | None Available |
Source: Public Records
Mortgage History
| Date | Status | Borrower | Loan Amount |
|---|---|---|---|
| Open | Smitty Enterprises Llc | $125,480 |
Source: Public Records
Tax History Compared to Growth
Tax History
| Year | Tax Paid | Tax Assessment Tax Assessment Total Assessment is a certain percentage of the fair market value that is determined by local assessors to be the total taxable value of land and additions on the property. | Land | Improvement |
|---|---|---|---|---|
| 2025 | $1,995 | $85,197 | $52,500 | $32,697 |
| 2024 | $1,995 | $85,864 | $51,000 | $34,864 |
| 2023 | $1,864 | $82,268 | $51,000 | $31,268 |
| 2022 | $1,579 | $66,457 | $39,075 | $27,382 |
| 2021 | $1,176 | $46,637 | $18,750 | $27,887 |
| 2020 | $833 | $31,569 | $8,550 | $23,019 |
| 2019 | $908 | $33,002 | $8,550 | $24,452 |
| 2018 | $418 | $15,076 | $6,000 | $9,076 |
| 2017 | $333 | $11,917 | $3,975 | $7,942 |
| 2016 | $324 | $11,591 | $4,500 | $7,091 |
| 2015 | $0 | $16,833 | $3,150 | $13,683 |
| 2014 | -- | $16,833 | $3,150 | $13,683 |
Source: Public Records
Map
Nearby Homes
- 326-328 W Morgan St
- 618 W Chestnut St
- 702 S Barrett Ave
- 705 W Crawford St
- 408 W Day St
- 326 W Day St
- 715 W Day St
- 511 W Munson St
- 506 W Woodard St
- 621 W Munson St
- 430 W Munson St
- 826 W Crawford St
- 831 W Owing St
- 901 W Owings St
- 830 W Shepherd St
- 920 W Morgan St
- 904 W Shepherd St
- TBD W Main St
- 1515 W Main St
- 701 W Hull St Unit 101-2
- 517 W Morgan St
- 521 W Morgan St
- 505 W Morgan St Unit 102
- 505 W Morgan St Unit 202
- 505 W Morgan St Unit 101
- 505 W Morgan St Unit A
- 516 W Morgan St
- 512 W Morgan St
- 510 W Morgan St
- 506 W Morgan St
- 410 S Mirick Ave Unit 410
- 410 S Mirick Ave Unit 416
- 410 S Mirick Ave Unit 414
- 410 S Mirick Ave Unit 412
- 410 S Mirick Ave
- 501 W Morgan St
- 413 S Fannin Ave
- 411 S Fannin Ave
- 500 W Morgan St
- 514 W Owing St