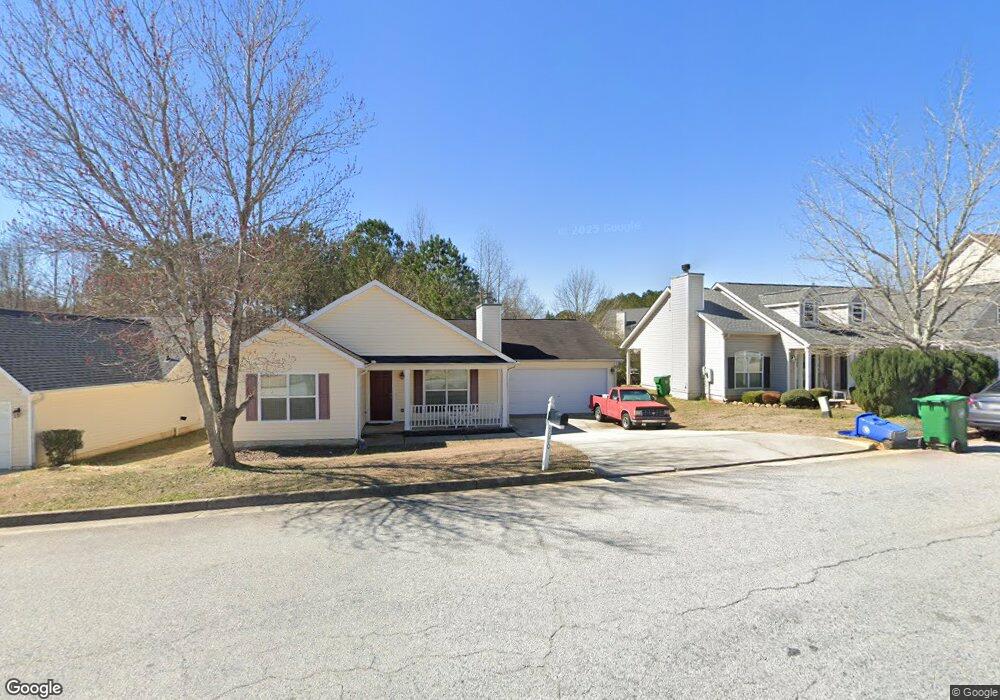
5070 River Overlook Way Lithonia, GA 30038
Estimated Value: $229,000 - $287,000
3
Beds
2
Baths
1,722
Sq Ft
$148/Sq Ft
Est. Value
About This Home
This home is located at 5070 River Overlook Way, Lithonia, GA 30038 and is currently estimated at $254,857, approximately $148 per square foot. 5070 River Overlook Way is a home located in DeKalb County with nearby schools including Murphy Candler Elementary School, Salem Middle School, and Martin Luther King- Jr. High School.
Ownership History
Date
Name
Owned For
Owner Type
Purchase Details
Closed on
Jul 21, 2014
Sold by
Johnson Paul Anthony
Bought by
Johnson Paul Anthony and Johnson Raisa
Current Estimated Value
Home Financials for this Owner
Home Financials are based on the most recent Mortgage that was taken out on this home.
Original Mortgage
$39,000
Outstanding Balance
$29,795
Interest Rate
4.24%
Mortgage Type
New Conventional
Estimated Equity
$225,062
Purchase Details
Closed on
Feb 4, 2014
Sold by
Bank Of America Na
Bought by
Secretary Of Housing And Urban
Purchase Details
Closed on
Jul 28, 2004
Sold by
Knight Group Inc
Bought by
Norman Janetta P
Home Financials for this Owner
Home Financials are based on the most recent Mortgage that was taken out on this home.
Original Mortgage
$143,020
Interest Rate
6.24%
Mortgage Type
VA
Create a Home Valuation Report for This Property
The Home Valuation Report is an in-depth analysis detailing your home's value as well as a comparison with similar homes in the area
Home Values in the Area
Average Home Value in this Area
Purchase History
| Date | Buyer | Sale Price | Title Company |
|---|---|---|---|
| Johnson Paul Anthony | -- | -- | |
| Johnson Paul Anthony | $78,000 | -- | |
| Secretary Of Housing And Urban | $189,049 | -- | |
| Norman Janetta P | $145,300 | -- |
Source: Public Records
Mortgage History
| Date | Status | Borrower | Loan Amount |
|---|---|---|---|
| Open | Johnson Paul Anthony | $39,000 | |
| Closed | Johnson Paul Anthony | $39,000 | |
| Previous Owner | Norman Janetta P | $143,020 |
Source: Public Records
Tax History Compared to Growth
Tax History
| Year | Tax Paid | Tax Assessment Tax Assessment Total Assessment is a certain percentage of the fair market value that is determined by local assessors to be the total taxable value of land and additions on the property. | Land | Improvement |
|---|---|---|---|---|
| 2025 | $2,892 | $109,960 | $18,000 | $91,960 |
| 2024 | $2,849 | $106,960 | $18,000 | $88,960 |
| 2023 | $2,849 | $111,480 | $18,000 | $93,480 |
| 2022 | $2,367 | $90,280 | $10,000 | $80,280 |
| 2021 | $1,810 | $65,720 | $6,760 | $58,960 |
| 2020 | $1,588 | $56,320 | $6,760 | $49,560 |
| 2019 | $1,483 | $51,560 | $6,760 | $44,800 |
| 2018 | $1,528 | $46,800 | $6,760 | $40,040 |
| 2017 | $1,485 | $43,960 | $6,760 | $37,200 |
| 2016 | $1,113 | $35,280 | $6,760 | $28,520 |
| 2014 | $1,288 | $38,680 | $6,760 | $31,920 |
Source: Public Records
Map
Nearby Homes
- 5100 River Overlook Way
- 4889 Ozment Ridge Ct
- 4895 Ozment Ridge Ct
- 4934 Serena Ct
- 4708 Golod Way Unit 2
- 4753 Klondike Cove
- 6226 Leverett Dr
- 6205 Leverett Dr
- 5009 Lynnonhall Ct
- 6114 Leverett Dr
- 6084 Leverett Dr
- 6177 Idlewood Cir
- 4632 Garden City Dr
- 4408 Idlewood Park
- 4701 Garden City Dr
- 5925 Idlewood Place
- 4273 Chestnut Lake Ave
- 4716 Idlewood Gate
- 5064 River Overlook Way
- 5076 River Overlook Way Unit 2
- 5058 River Overlook Way Unit 2
- 0 River Overlook Way Unit 7541229
- 5082 River Overlook Way
- 6234 Serena Cove
- 6446 Gina Agha Cir
- 5052 River Overlook Way Unit 2
- 0 River Overlook Way Unit 8464917
- 0 River Overlook Way Unit 7594988
- 0 River Overlook Way Unit 8290674
- 0 River Overlook Way Unit 7206582
- 0 River Overlook Way Unit 9026192
- 0 River Overlook Way Unit 3235299
- 0 River Overlook Way Unit 3238736
- 0 River Overlook Way Unit 7147950
- 0 River Overlook Way Unit 7214947
- 0 River Overlook Way Unit 7224286
- 0 River Overlook Way
- 5063 River Overlook Way