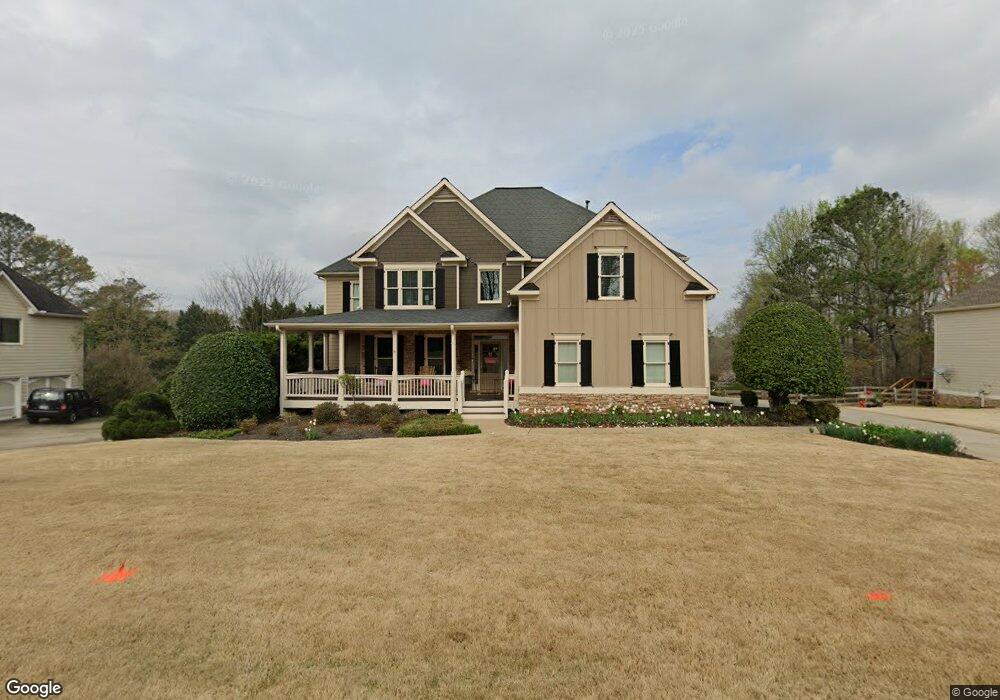
5070 Trailing Fox Dr Cumming, GA 30040
Estimated Value: $661,352 - $738,000
5
Beds
4
Baths
4,500
Sq Ft
$154/Sq Ft
Est. Value
About This Home
This home is located at 5070 Trailing Fox Dr, Cumming, GA 30040 and is currently estimated at $690,838, approximately $153 per square foot. 5070 Trailing Fox Dr is a home located in Forsyth County with nearby schools including Sawnee Elementary School, Otwell Middle School, and Forsyth Central High School.
Ownership History
Date
Name
Owned For
Owner Type
Purchase Details
Closed on
Jun 26, 2020
Sold by
Beynon Jennifer A
Bought by
Pierce Mark Daniel and Pierce Laurie Rucker
Current Estimated Value
Home Financials for this Owner
Home Financials are based on the most recent Mortgage that was taken out on this home.
Original Mortgage
$389,193
Outstanding Balance
$345,111
Interest Rate
3.1%
Mortgage Type
FHA
Estimated Equity
$345,727
Purchase Details
Closed on
May 6, 2005
Sold by
Tom Dill Co
Bought by
Beynon Casey and Beynon Jennifer
Home Financials for this Owner
Home Financials are based on the most recent Mortgage that was taken out on this home.
Original Mortgage
$169,900
Interest Rate
5.98%
Mortgage Type
New Conventional
Purchase Details
Closed on
Mar 17, 2004
Sold by
Hansard Properties Inc
Bought by
Tom Dill Co
Home Financials for this Owner
Home Financials are based on the most recent Mortgage that was taken out on this home.
Original Mortgage
$258,750
Interest Rate
5.54%
Create a Home Valuation Report for This Property
The Home Valuation Report is an in-depth analysis detailing your home's value as well as a comparison with similar homes in the area
Home Values in the Area
Average Home Value in this Area
Purchase History
| Date | Buyer | Sale Price | Title Company |
|---|---|---|---|
| Pierce Mark Daniel | $425,000 | -- | |
| Beynon Casey | $344,900 | -- | |
| Tom Dill Co | $60,500 | -- |
Source: Public Records
Mortgage History
| Date | Status | Borrower | Loan Amount |
|---|---|---|---|
| Open | Pierce Mark Daniel | $389,193 | |
| Previous Owner | Beynon Casey | $169,900 | |
| Previous Owner | Tom Dill Co | $258,750 |
Source: Public Records
Tax History Compared to Growth
Tax History
| Year | Tax Paid | Tax Assessment Tax Assessment Total Assessment is a certain percentage of the fair market value that is determined by local assessors to be the total taxable value of land and additions on the property. | Land | Improvement |
|---|---|---|---|---|
| 2025 | $5,485 | $239,684 | $40,000 | $199,684 |
| 2024 | $5,485 | $232,036 | $40,000 | $192,036 |
| 2023 | $5,319 | $216,096 | $34,000 | $182,096 |
| 2022 | $4,768 | $151,236 | $24,000 | $127,236 |
| 2021 | $4,176 | $151,236 | $24,000 | $127,236 |
| 2020 | $3,727 | $143,376 | $24,000 | $119,376 |
| 2019 | $3,560 | $135,036 | $18,000 | $117,036 |
| 2018 | $3,609 | $137,020 | $18,000 | $119,020 |
| 2017 | $3,336 | $123,432 | $18,000 | $105,432 |
| 2016 | $3,283 | $121,432 | $16,000 | $105,432 |
| 2015 | $3,289 | $121,432 | $16,000 | $105,432 |
| 2014 | $2,831 | $110,212 | $14,000 | $96,212 |
Source: Public Records
Map
Nearby Homes
- 3365 Aldrich Dr
- 4920 Mccoy Cir
- 2530 Kings Ct
- 2930 Aquitania Ln
- LYNNBROOK Plan at Thalley Creek Estates
- WESTERLY Plan at Thalley Creek Estates
- BELLVIEW Plan at Thalley Creek Estates
- GRAYSON Plan at Thalley Creek Estates
- EDINBURGH Plan at Thalley Creek Estates
- SONOMA Plan at Thalley Creek Estates
- 2830 Gramercy Ct
- 5010 Thalley Creek Dr
- 2765 Aldrich Dr
- 4985 Mccoy Cir
- 5095 Karr Rd
- 4900 Spot Rd
- 2275 Doctor Bramblett Rd
- 0 Memphis St Unit 7679950
- 0 Memphis St Unit 10641832
- 5910 Karr Rd
- 5060 Trailing Fox Dr
- 5080 Trailing Fox Dr
- 5065 Trailing Fox Dr
- 5090 Trailing Fox Dr
- 5085 Trailing Fox Dr
- 3210 Aldrich Dr
- 3130 Aldrich Dr
- 5075 Trailing Fox Dr
- 3204 Aldrich Dr
- 3140 Aldrich Dr
- 5055 Trailing Fox Dr
- 5110 Trailing Fox Dr
- 3220 Aldrich Dr
- 5050 Trailing Fox Dr
- 5095 Trailing Fox Dr
- 5045 Trailing Fox Dr
- 3120 Aldrich Dr
- 3205 Amberwood Ln
- 5040 Trailing Fox Dr
- 3240 Aldrich Dr