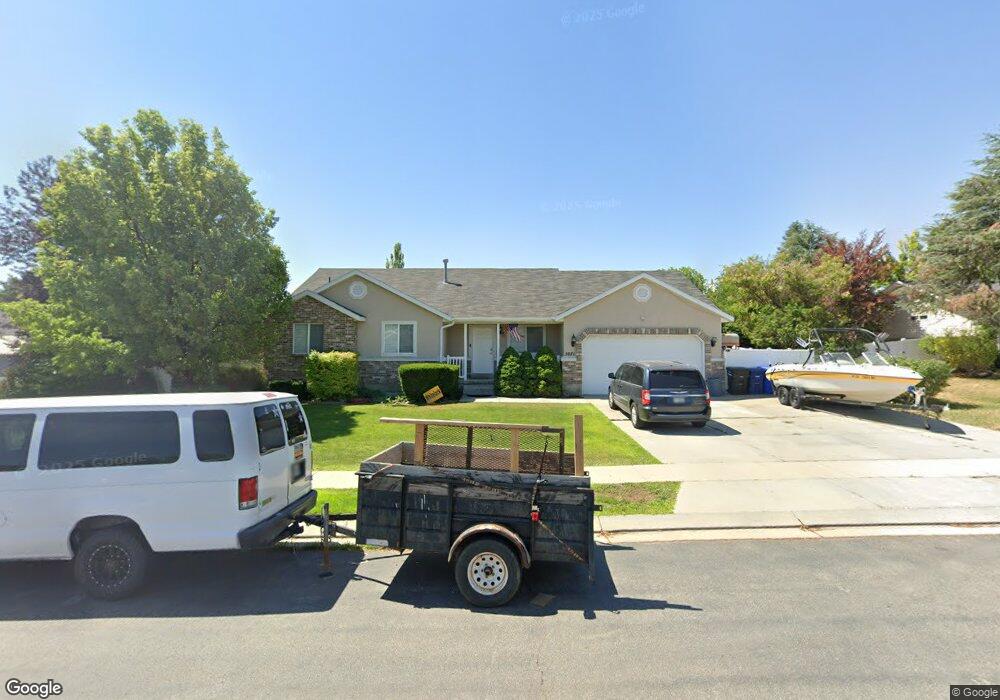
5071 W 8820 S West Jordan, UT 84081
Copper Hills NeighborhoodEstimated Value: $612,000 - $640,000
4
Beds
3
Baths
3,100
Sq Ft
$202/Sq Ft
Est. Value
About This Home
This home is located at 5071 W 8820 S, West Jordan, UT 84081 and is currently estimated at $626,899, approximately $202 per square foot. 5071 W 8820 S is a home located in Salt Lake County with nearby schools including Jordan Hills Elementary School, West Hills Middle School, and Copper Hills High School.
Ownership History
Date
Name
Owned For
Owner Type
Purchase Details
Closed on
May 16, 2006
Sold by
Hafoka Kalani N
Bought by
Hafoka Kalani N and Sete Sepa P
Current Estimated Value
Home Financials for this Owner
Home Financials are based on the most recent Mortgage that was taken out on this home.
Original Mortgage
$43,350
Interest Rate
6.41%
Mortgage Type
Stand Alone Second
Purchase Details
Closed on
Jun 4, 2002
Sold by
Smith Eric R and Smith Brooke R
Bought by
Bulloch Russ and Bulloch Ellen
Home Financials for this Owner
Home Financials are based on the most recent Mortgage that was taken out on this home.
Original Mortgage
$178,500
Interest Rate
6.83%
Purchase Details
Closed on
Jul 20, 1999
Sold by
Orion Investments Lc
Bought by
Royal View Homes Inc
Home Financials for this Owner
Home Financials are based on the most recent Mortgage that was taken out on this home.
Original Mortgage
$165,947
Interest Rate
7.51%
Purchase Details
Closed on
Sep 28, 1998
Sold by
Kfp Corp
Bought by
Royal View Homes Inc
Create a Home Valuation Report for This Property
The Home Valuation Report is an in-depth analysis detailing your home's value as well as a comparison with similar homes in the area
Home Values in the Area
Average Home Value in this Area
Purchase History
| Date | Buyer | Sale Price | Title Company |
|---|---|---|---|
| Hafoka Kalani N | -- | First American Title | |
| Hafoka Kalani N | -- | First American Title | |
| Bulloch Russ | -- | First Amer Title Ins Agency | |
| Royal View Homes Inc | -- | Meridian Title | |
| Smith Eric R | -- | Meridian Title | |
| Royal View Homes Inc | -- | -- |
Source: Public Records
Mortgage History
| Date | Status | Borrower | Loan Amount |
|---|---|---|---|
| Open | Hafoka Kalani N | $69,567 | |
| Closed | Hafoka Kalani N | $43,350 | |
| Previous Owner | Bulloch Russ | $33,000 | |
| Previous Owner | Bulloch Russ | $178,500 | |
| Previous Owner | Smith Eric R | $165,947 |
Source: Public Records
Tax History Compared to Growth
Tax History
| Year | Tax Paid | Tax Assessment Tax Assessment Total Assessment is a certain percentage of the fair market value that is determined by local assessors to be the total taxable value of land and additions on the property. | Land | Improvement |
|---|---|---|---|---|
| 2025 | $3,061 | $595,300 | $169,300 | $426,000 |
| 2024 | $3,061 | $589,000 | $167,600 | $421,400 |
| 2023 | $3,091 | $560,400 | $158,100 | $402,300 |
| 2022 | $3,043 | $542,900 | $155,000 | $387,900 |
| 2021 | $2,573 | $417,800 | $120,500 | $297,300 |
| 2020 | $2,400 | $365,700 | $120,500 | $245,200 |
| 2019 | $2,365 | $353,500 | $113,700 | $239,800 |
| 2018 | $2,244 | $332,700 | $113,700 | $219,000 |
| 2017 | $2,027 | $299,100 | $113,700 | $185,400 |
| 2016 | $1,976 | $274,000 | $113,700 | $160,300 |
| 2015 | $2,019 | $272,900 | $120,200 | $152,700 |
| 2014 | $1,862 | $247,900 | $110,500 | $137,400 |
Source: Public Records
Map
Nearby Homes
- 5094 Pebblerock Cir
- 8741 S 4870 W
- 8854 Rocky Creek Dr
- 4887 W 8620 S
- 4902 Pine Laurel Ln
- 4857 Muirkirk Rd
- 9182 Wisteria Way
- 9172 S Plume Ct
- 9288 Winter Berry Dr
- 5551 Geronimo Way
- 8851 Humboldt Ct
- 9078 Harkness Dr
- 5582 Washoe Cove
- 8322 Copper Vista Cir
- 4707 W Granada Hills Ct
- 8499 S Boulder Creek Rd
- 8377 Wild Oak Dr
- 4572 Bingham Park Dr
- 8359 Etude Dr
- 8894 S Sun Leaf Dr
- 5085 W 8820 S
- 5072 W 8860 S
- 8832 Boulder Wash Ln
- 8846 Boulder Wash Ln
- 5086 W 8860 S
- 5056 W 8860 S
- 5068 W 8820 S
- 5084 W 8820 S
- 5101 W 8820 S
- 5052 W 8820 S
- 5102 W 8860 S
- 5098 W 8820 S
- 8831 S Boulder Wash La
- 5038 W 8820 S
- 8877 S Stone Spring Cir
- 8831 Boulder Wash Ln
- 8877 S Stone Spring Cir
- 8872 Boulder Washington Ln
- 8847 S Boulder Wash Ln
- 8847 Boulder Wash Ln