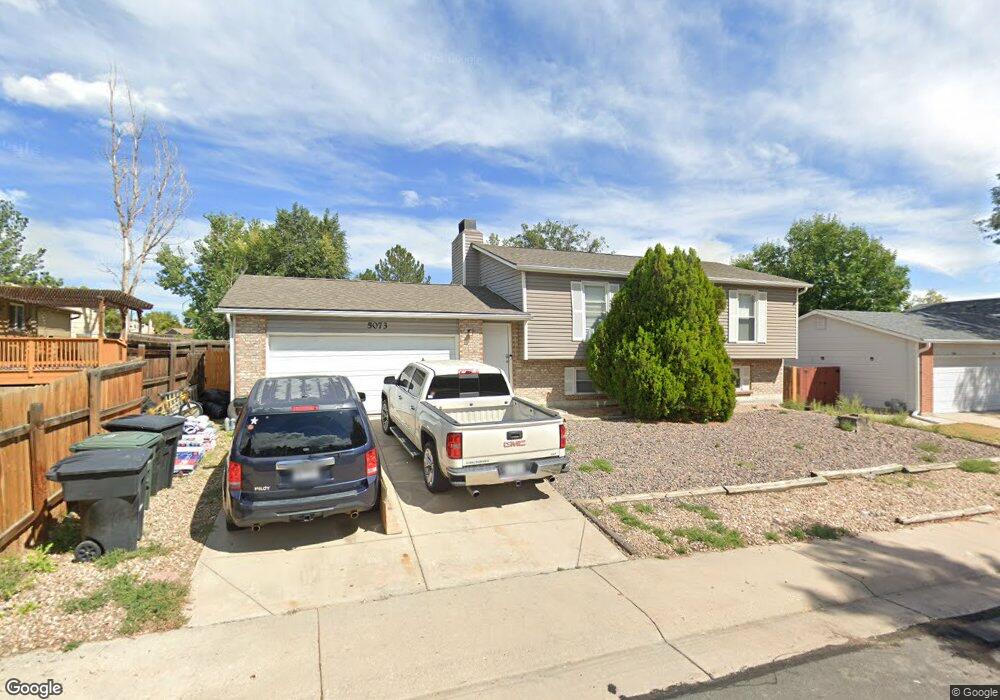
5073 E 111th Place Thornton, CO 80233
Grange Creek NeighborhoodEstimated Value: $468,000 - $530,000
4
Beds
2
Baths
1,885
Sq Ft
$259/Sq Ft
Est. Value
About This Home
This home is located at 5073 E 111th Place, Thornton, CO 80233 and is currently estimated at $488,296, approximately $259 per square foot. 5073 E 111th Place is a home located in Adams County with nearby schools including Riverdale Elementary School, Shadow Ridge Middle School, and Thornton High School.
Ownership History
Date
Name
Owned For
Owner Type
Purchase Details
Closed on
Jun 7, 2019
Sold by
2019 1H Borrower Lp
Bought by
2019 1H Borrower Lp
Current Estimated Value
Purchase Details
Closed on
Nov 3, 2016
Sold by
Beauly Llc
Bought by
Csh 2016 2 Borroower Llc
Purchase Details
Closed on
Jul 9, 2014
Sold by
Rutherford Julie D and Rutherford James D
Bought by
Beauly Llc
Create a Home Valuation Report for This Property
The Home Valuation Report is an in-depth analysis detailing your home's value as well as a comparison with similar homes in the area
Home Values in the Area
Average Home Value in this Area
Purchase History
| Date | Buyer | Sale Price | Title Company |
|---|---|---|---|
| 2019 1H Borrower Lp | -- | Os National Llc | |
| Csh 2016 2 Borroower Llc | -- | Os National Llc | |
| Beauly Llc | -- | None Available |
Source: Public Records
Tax History Compared to Growth
Tax History
| Year | Tax Paid | Tax Assessment Tax Assessment Total Assessment is a certain percentage of the fair market value that is determined by local assessors to be the total taxable value of land and additions on the property. | Land | Improvement |
|---|---|---|---|---|
| 2024 | $3,089 | $29,190 | $5,940 | $23,250 |
| 2023 | $3,057 | $33,560 | $6,090 | $27,470 |
| 2022 | $2,583 | $23,450 | $5,700 | $17,750 |
| 2021 | $2,669 | $23,450 | $5,700 | $17,750 |
| 2020 | $2,313 | $20,730 | $5,860 | $14,870 |
| 2019 | $2,317 | $20,730 | $5,860 | $14,870 |
| 2018 | $2,236 | $19,430 | $5,760 | $13,670 |
| 2017 | $2,033 | $19,430 | $5,760 | $13,670 |
| 2016 | $1,735 | $16,140 | $3,260 | $12,880 |
| 2015 | $1,732 | $16,140 | $3,260 | $12,880 |
| 2014 | $1,714 | $12,680 | $2,550 | $10,130 |
Source: Public Records
Map
Nearby Homes
- 11062 Fairfax Cir
- 11293 Holly St
- 11279 Holly St
- 5056 E 112th Ct
- 5055 E 112th Ct
- 11068 Eudora Cir
- 10985 Glencoe Place
- 4807 E 110th Place
- 11343 Grape Cir
- 10979 Grange Creek Dr
- 4911 E 112th Place
- 10895 Fairfax Way
- 5452 E 108th Place
- 11135 Clermont Dr
- 11354 Jersey St
- 4520 E 112th Place
- 11306 Newport St
- 4346 E 113th Place
- 11841 Elm Dr
- 4310 E 107th Ct
- 5093 E 111th Place
- 5053 E 111th Place
- 5033 E 111th Place
- 5103 E 111th Place
- 5221 E 111th Ct
- 5092 E 111th Place
- 5241 E 111th Ct
- 5102 E 111th Place
- 5003 E 111th Place
- 5201 E 112th Ct
- 5002 E 111th Place
- 5133 E 111th Place
- 5132 E 111th Place
- 5261 E 111th Ct
- 5201 E 111th Ct
- 4973 E 111th Place
- 4992 E 111th Place
- 4993 E 111th Place
- 11164 Forest Ave
- 11156 Forest Ave