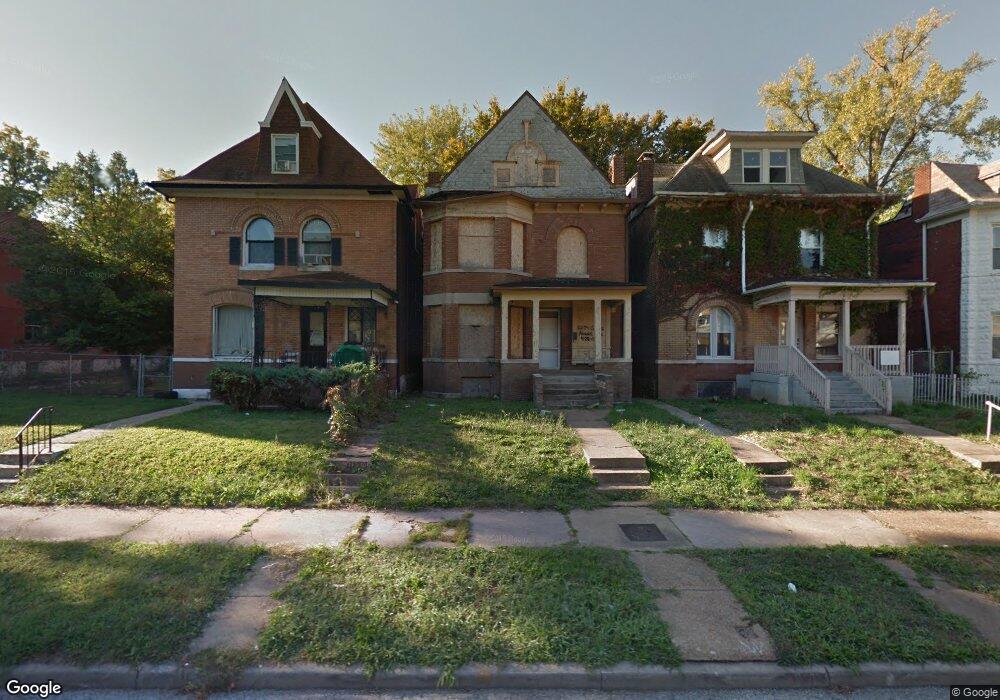
5074 Cates Ave Saint Louis, MO 63108
Academy NeighborhoodEstimated Value: $79,263 - $144,000
5
Beds
2
Baths
1,900
Sq Ft
$59/Sq Ft
Est. Value
About This Home
This home is located at 5074 Cates Ave, Saint Louis, MO 63108 and is currently estimated at $112,316, approximately $59 per square foot. 5074 Cates Ave is a home located in St. Louis City with nearby schools including Sumner High School, The Biome, and Hawthorn High School.
Ownership History
Date
Name
Owned For
Owner Type
Purchase Details
Closed on
Sep 4, 2024
Sold by
Sheriff Of The City Of St Louis
Bought by
Academy-Sherman Park Neighborhood Association
Current Estimated Value
Purchase Details
Closed on
Jan 8, 2019
Sold by
City Of St Louis
Bought by
Schmidt Diane
Purchase Details
Closed on
Mar 22, 2010
Sold by
Secretary Of Housing & Urban Development
Bought by
Pruitt Shenise L
Purchase Details
Closed on
Jul 14, 2008
Sold by
Charleston Clea O
Bought by
Bank Of New York and Certificateholders Of Asset Backed Certi
Purchase Details
Closed on
May 13, 1999
Sold by
Richardson James W and Richardson Bertha W
Bought by
Charleston Clea O
Home Financials for this Owner
Home Financials are based on the most recent Mortgage that was taken out on this home.
Original Mortgage
$52,216
Interest Rate
6.94%
Mortgage Type
FHA
Create a Home Valuation Report for This Property
The Home Valuation Report is an in-depth analysis detailing your home's value as well as a comparison with similar homes in the area
Home Values in the Area
Average Home Value in this Area
Purchase History
We collect this data history from publicly available records. To have your information removed, we recommend requesting removal directly through your county’s website.
| Date | Buyer | Sale Price | Title Company |
|---|---|---|---|
| Academy-Sherman Park Neighborhood Association | -- | None Listed On Document | |
| Academy-Sherman Park Neighborhood Association | -- | None Listed On Document | |
| Schmidt Diane | $5,500 | None Available | |
| Pruitt Shenise L | -- | None Available | |
| Bank Of New York | $57,191 | None Available | |
| Charleston Clea O | -- | -- |
Source: Public Records
Mortgage History
We collect this data history from publicly available records. To have your information removed, we recommend requesting removal directly through your county’s website.
| Date | Status | Borrower | Loan Amount |
|---|---|---|---|
| Previous Owner | Charleston Clea O | $52,216 | |
| Closed | Charleston Clea O | $2,500 |
Source: Public Records
Tax History
| Year | Tax Paid | Tax Assessment Tax Assessment Total Assessment is a certain percentage of the fair market value that is determined by local assessors to be the total taxable value of land and additions on the property. | Land | Improvement |
|---|---|---|---|---|
| 2025 | $262 | $2,980 | $630 | $2,350 |
| 2024 | $251 | $2,800 | $630 | $2,170 |
| 2023 | $251 | $2,800 | $630 | $2,170 |
| 2022 | $253 | $2,720 | $630 | $2,090 |
| 2021 | $253 | $2,720 | $630 | $2,090 |
| 2020 | $235 | $2,530 | $630 | $1,900 |
| 2019 | $234 | $2,530 | $630 | $1,900 |
| 2018 | $211 | $2,170 | $630 | $1,540 |
| 2017 | $208 | $2,170 | $630 | $1,540 |
| 2016 | $258 | $2,740 | $930 | $1,810 |
| 2015 | $236 | $2,740 | $930 | $1,810 |
| 2014 | $250 | $2,740 | $930 | $1,810 |
| 2013 | -- | $2,930 | $930 | $2,000 |
Source: Public Records
Map
Nearby Homes
- 5044 Raymond Ave
- 5089 Raymond Ave
- 5179 Kensington Ave
- 753 Aubert Ave
- 4923 Suburban Tracks St
- 5186 Vernon Ave
- 916 Clarendon Ave
- 5137 Washington Place
- 5233 Cates Ave
- 743 N Euclid Ave
- 6000 Washington Ave Unit 102
- 6000 Washington Ave Unit 101
- 5165 Maple Ave
- 4937 Washington Blvd
- 5123 Westminster Place
- 1215 N Euclid Ave
- 1200 N Euclid Ave
- 4901 Washington Blvd Unit 4B
- 4901 Washington Blvd Unit 2C
- 4957 Mcpherson Ave Unit 57D
- 5072 Cates Ave
- 5076 Cates Ave
- 5078 Cates Ave
- 5068 Cates Ave
- 5064 Cates Ave
- 5064 Cates Ave Unit Upstairs
- 5056 Cates Ave
- 5079 Cates Ave
- 5075 Cates Ave
- 5052 Cates Ave
- 5075 Kensington Ave
- 5077 Kensington Ave
- 5073 Cates Ave
- 5067 Cates Ave
- 5081 Cates Ave
- 5065 Kensington Ave
- 5050 Cates Ave
- 5085 Cates Ave
- 5065 Cates Ave
- 5130 Cates Ave
Your Personal Tour Guide
Ask me questions while you tour the home.