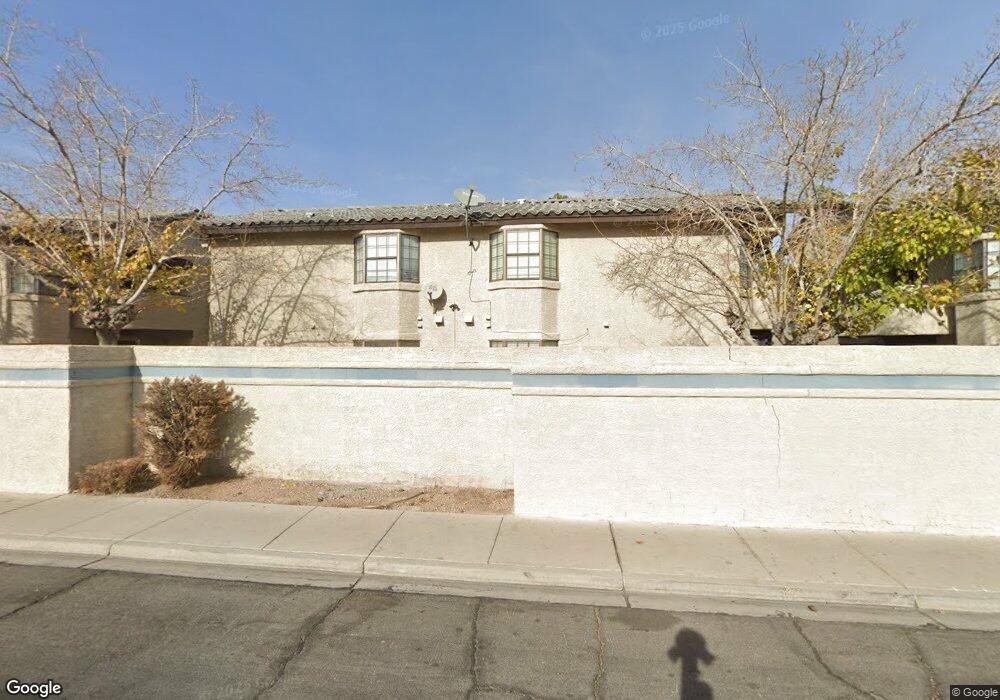
5076 Jeffreys St Las Vegas, NV 89119
University District NeighborhoodEstimated Value: $215,000 - $241,000
2
Beds
2
Baths
1,000
Sq Ft
$228/Sq Ft
Est. Value
About This Home
This home is located at 5076 Jeffreys St, Las Vegas, NV 89119 and is currently estimated at $228,425, approximately $228 per square foot. 5076 Jeffreys St is a home located in Clark County with nearby schools including Jack Dailey Elementary School, Gene Ward Elementary School, and Helen C. Cannon Junior High School.
Ownership History
Date
Name
Owned For
Owner Type
Purchase Details
Closed on
Apr 13, 2022
Sold by
Noora El-Nemr
Bought by
Sales Noraline and Ayala Edmund
Current Estimated Value
Home Financials for this Owner
Home Financials are based on the most recent Mortgage that was taken out on this home.
Original Mortgage
$180,000
Outstanding Balance
$168,917
Interest Rate
4.16%
Mortgage Type
New Conventional
Estimated Equity
$59,508
Purchase Details
Closed on
Dec 27, 2021
Sold by
Mona Asberom 2009 Trust
Bought by
El-Nemr Noora and Krikorova Gayane
Purchase Details
Closed on
Dec 21, 2021
Sold by
Asberom Mona and Mona Asberom 2009 Trust
Bought by
El Nemr Noora and Krikorova Gayane
Purchase Details
Closed on
Dec 14, 2021
Sold by
Debarras Anderson
Bought by
Krikorova Gayane
Purchase Details
Closed on
Dec 30, 2009
Sold by
Asberom Mona
Bought by
Asberom Mona and The Mona Asberom 2009 Trust
Purchase Details
Closed on
Apr 8, 1996
Sold by
Gebre Michael Amdetsion and Gebremeskel Metslal
Bought by
Asberom Mona
Create a Home Valuation Report for This Property
The Home Valuation Report is an in-depth analysis detailing your home's value as well as a comparison with similar homes in the area
Home Values in the Area
Average Home Value in this Area
Purchase History
| Date | Buyer | Sale Price | Title Company |
|---|---|---|---|
| Sales Noraline | $255,000 | First American Title | |
| El-Nemr Noora | $160,300 | Equity Title | |
| El Nemr Noora | $160,300 | Equity Title Of Nevada | |
| Krikorova Gayane | -- | Equity Title | |
| Asberom Mona | -- | None Available | |
| Asberom Mona | -- | Stewart Title |
Source: Public Records
Mortgage History
| Date | Status | Borrower | Loan Amount |
|---|---|---|---|
| Open | Sales Noraline | $180,000 |
Source: Public Records
Tax History Compared to Growth
Tax History
| Year | Tax Paid | Tax Assessment Tax Assessment Total Assessment is a certain percentage of the fair market value that is determined by local assessors to be the total taxable value of land and additions on the property. | Land | Improvement |
|---|---|---|---|---|
| 2025 | $668 | $36,134 | $16,100 | $20,034 |
| 2024 | $619 | $36,134 | $16,100 | $20,034 |
| 2023 | $619 | $38,436 | $19,600 | $18,836 |
| 2022 | $574 | $31,970 | $14,350 | $17,620 |
| 2021 | $534 | $30,495 | $13,300 | $17,195 |
| 2020 | $491 | $29,829 | $12,600 | $17,229 |
| 2019 | $460 | $26,387 | $9,100 | $17,287 |
| 2018 | $439 | $22,617 | $5,600 | $17,017 |
| 2017 | $657 | $22,413 | $4,900 | $17,513 |
| 2016 | $412 | $21,336 | $4,550 | $16,786 |
| 2015 | $410 | $17,101 | $3,500 | $13,601 |
| 2014 | $397 | $13,137 | $3,500 | $9,637 |
Source: Public Records
Map
Nearby Homes
- 5086 Jeffreys St Unit 201
- 2410 Paradise Village Way
- 2454 Paradise Village Way
- 5065 Celebrity Cir
- 5004 Celebrity Cir
- 2297 Casey Dr
- 4955 Jeffreys St Unit 605
- 2574 Paradise Village Way
- 5060 Newport Cove Dr Unit B
- 5060 Newport Cove Dr Unit C
- 2486 Leigh Ave
- 4941 Newport Cove Dr Unit B
- 5078 Spencer St Unit D
- 2184 Sunnyslope Ave
- 5254 Dickens Dr Unit 3
- 5064 Spencer St Unit B
- 5260 Dickens Dr
- 5399 Surrey St
- 4774 Walteta Way
- 5328 Topaz St
- 5076 Jeffreys St Unit 101
- 5076 Jeffreys St Unit 102
- 5076 Jeffreys St Unit 202
- 5076 Jeffreys St Unit 201
- 5080 Jeffreys St Unit 102
- 5080 Jeffreys St Unit 202
- 5080 Jeffreys St Unit 201
- 5074 Jeffreys St Unit 202
- 5074 Jeffreys St Unit 201
- 5074 Jeffreys St Unit 102
- 5074 Jeffreys St Unit 101
- 5066 Jeffreys St Unit 201
- 5066 Jeffreys St Unit 102
- 5066 Jeffreys St Unit 202
- 5084 Jeffreys St Unit 202
- 5084 Jeffreys St Unit 101
- 5084 Jeffreys St Unit 102
- 5084 Jeffreys St Unit 201
- 5078 Jeffreys St Unit 201