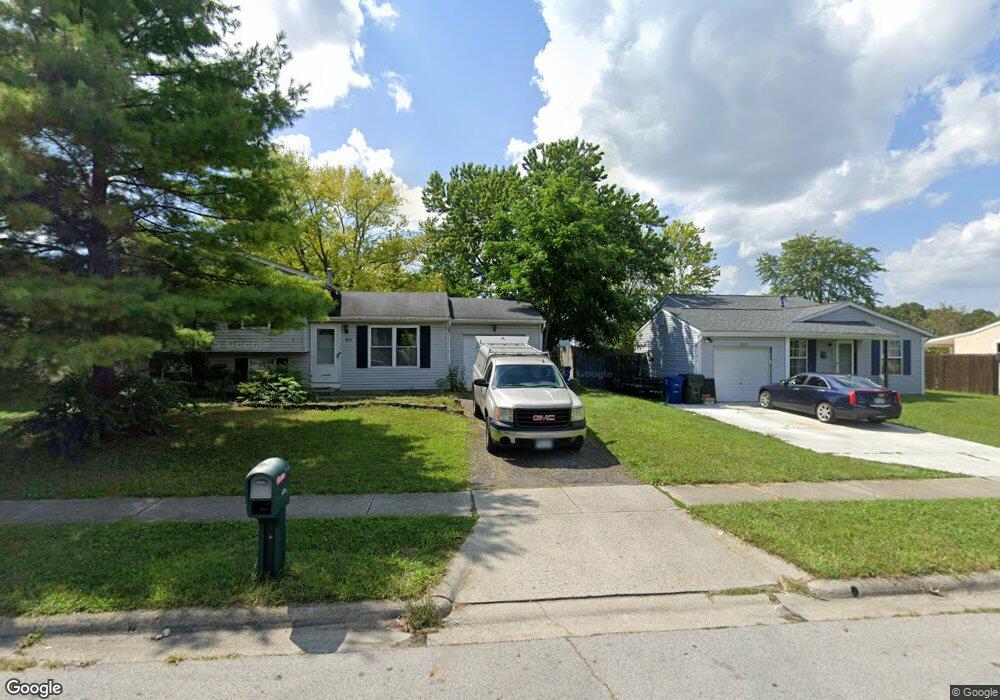
5076 N Cherry Creek Columbus, OH 43228
Cherry Creek NeighborhoodEstimated Value: $160,000 - $200,000
3
Beds
1
Bath
816
Sq Ft
$225/Sq Ft
Est. Value
About This Home
This home is located at 5076 N Cherry Creek, Columbus, OH 43228 and is currently estimated at $183,255, approximately $224 per square foot. 5076 N Cherry Creek is a home located in Franklin County with nearby schools including Prairie Norton Elementary School, Holt Crossing Intermediate School, and Pleasant View Middle School.
Ownership History
Date
Name
Owned For
Owner Type
Purchase Details
Closed on
Sep 4, 2015
Sold by
Bell Matthew
Bought by
Casto Adam S and Casto Jamie R
Current Estimated Value
Home Financials for this Owner
Home Financials are based on the most recent Mortgage that was taken out on this home.
Original Mortgage
$64,306
Outstanding Balance
$50,439
Interest Rate
3.87%
Mortgage Type
FHA
Estimated Equity
$132,816
Purchase Details
Closed on
Dec 6, 2013
Sold by
Bell Miriam R
Bought by
Bell Matthew
Purchase Details
Closed on
May 28, 2002
Sold by
Jacobs Patricia E and Jacobs Patricia E
Bought by
Bell Matthew and Bell Miriam R
Home Financials for this Owner
Home Financials are based on the most recent Mortgage that was taken out on this home.
Original Mortgage
$79,271
Interest Rate
6.87%
Mortgage Type
FHA
Purchase Details
Closed on
May 6, 1994
Bought by
Jacobs Patricia E
Create a Home Valuation Report for This Property
The Home Valuation Report is an in-depth analysis detailing your home's value as well as a comparison with similar homes in the area
Home Values in the Area
Average Home Value in this Area
Purchase History
| Date | Buyer | Sale Price | Title Company |
|---|---|---|---|
| Casto Adam S | $65,500 | Stewart Title Agency | |
| Bell Matthew | -- | None Available | |
| Bell Matthew | $79,900 | Independent Title | |
| Jacobs Patricia E | $52,500 | -- |
Source: Public Records
Mortgage History
| Date | Status | Borrower | Loan Amount |
|---|---|---|---|
| Open | Casto Adam S | $64,306 | |
| Previous Owner | Bell Matthew | $79,271 |
Source: Public Records
Tax History Compared to Growth
Tax History
| Year | Tax Paid | Tax Assessment Tax Assessment Total Assessment is a certain percentage of the fair market value that is determined by local assessors to be the total taxable value of land and additions on the property. | Land | Improvement |
|---|---|---|---|---|
| 2024 | $1,729 | $47,430 | $16,450 | $30,980 |
| 2023 | $1,699 | $47,430 | $16,450 | $30,980 |
| 2022 | $1,351 | $27,690 | $8,090 | $19,600 |
| 2021 | $1,379 | $27,690 | $8,090 | $19,600 |
| 2020 | $1,371 | $27,690 | $8,090 | $19,600 |
| 2019 | $1,267 | $22,580 | $6,760 | $15,820 |
| 2018 | $1,210 | $22,580 | $6,760 | $15,820 |
| 2017 | $1,207 | $22,580 | $6,760 | $15,820 |
| 2016 | $1,159 | $19,150 | $4,730 | $14,420 |
| 2015 | $1,159 | $19,150 | $4,730 | $14,420 |
| 2014 | $1,160 | $19,150 | $4,730 | $14,420 |
| 2013 | $605 | $20,160 | $4,970 | $15,190 |
Source: Public Records
Map
Nearby Homes
- 5006 Old Tree Ave
- 4950 Cherry Creek Pkwy S
- 429 Postle Blvd
- 840 Cherry Bud Dr
- 354 Fernhill Ave
- 4848 Deephollow Dr
- 435 Redmond Rd
- 4789 Dolan Place
- 4778 Hafey Ave
- 4763 Hafey Ave
- 542 Clairbrook Ave Unit 11
- 805 Pipers Ln
- 491 Clairbrook Ave Unit 3
- 579 Simbury St Unit B9
- 477 Clairbrook Ave
- 264 Woodlawn Ave
- 4715 Sullivant Ave Unit 46
- 488 Lombard Rd
- 515 Clairbrook Ave
- 452 Pamlico St Unit 9
- 5076 Cherry Creek Pkwy N
- 5084 N Cherry Creek
- 5084 Cherry Creek Pkwy N
- 647 Oak Hollow Ct
- 625 Oak Hollow Ct
- 5092 Cherry Creek Pkwy N
- 617 Oak Hollow Ct
- 613 Oak Hollow Ct
- 5100 N Cherry Creek
- 5100 Cherry Creek Pkwy N
- 609 Oak Hollow Ct
- 636 Oak Hollow Ct
- 640 Oak Hollow Ct
- 5050 Cherry Creek Pkwy N
- 5108 Cherry Creek Pkwy N
- 632 Oak Hollow Ct
- 605 Oak Hollow Ct
- 628 Oak Hollow Ct
- 5116 Cherry Creek Pkwy N
- 624 Oak Hollow Ct