5077 Preston Rd Shelby, OH 44875
Estimated Value: $288,443 - $335,000
3
Beds
2
Baths
2,392
Sq Ft
$132/Sq Ft
Est. Value
About This Home
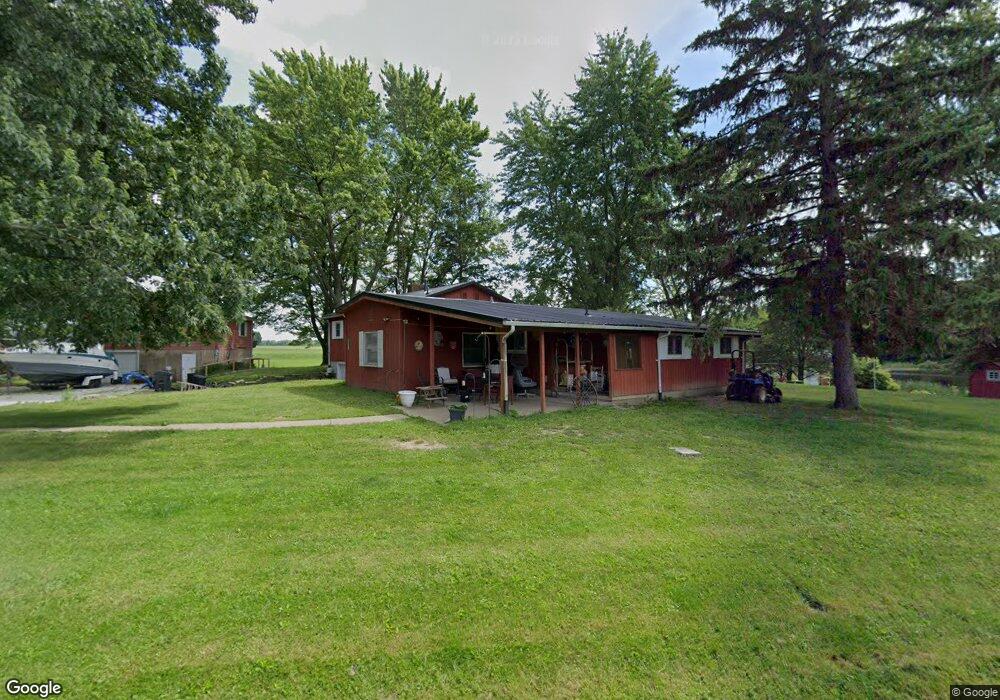
This home is located at 5077 Preston Rd, Shelby, OH 44875 and is currently estimated at $315,111, approximately $131 per square foot. 5077 Preston Rd is a home located in Richland County with nearby schools including Shiloh Elementary School, Shiloh Middle School, and Plymouth High School.
Ownership History
Date
Name
Owned For
Owner Type
Purchase Details
Closed on
Jan 22, 2007
Sold by
Harrison Brian R and Hainline Ashley N
Bought by
Kennard Matthew S and Kennard Dawn M
Current Estimated Value
Home Financials for this Owner
Home Financials are based on the most recent Mortgage that was taken out on this home.
Original Mortgage
$133,000
Outstanding Balance
$79,259
Interest Rate
6.16%
Mortgage Type
Purchase Money Mortgage
Estimated Equity
$235,852
Purchase Details
Closed on
May 26, 2006
Sold by
Deetz Johnson William Chet and Deetz Johnson Holly
Bought by
Harrison Brian R and Hainline Ashley N
Home Financials for this Owner
Home Financials are based on the most recent Mortgage that was taken out on this home.
Original Mortgage
$121,043
Interest Rate
6.62%
Mortgage Type
FHA
Purchase Details
Closed on
Oct 5, 1993
Bought by
Fenner Joseph L
Purchase Details
Closed on
Mar 26, 1992
Sold by
Roethlisberger Ruth A
Bought by
Reece T Clemens Trustee Etc
Create a Home Valuation Report for This Property
The Home Valuation Report is an in-depth analysis detailing your home's value as well as a comparison with similar homes in the area
Home Values in the Area
Average Home Value in this Area
Purchase History
| Date | Buyer | Sale Price | Title Company |
|---|---|---|---|
| Kennard Matthew S | $133,000 | Barrister Title | |
| Harrison Brian R | $122,000 | Southern Title | |
| Fenner Joseph L | $67,000 | -- | |
| Reece T Clemens Trustee Etc | -- | -- |
Source: Public Records
Mortgage History
| Date | Status | Borrower | Loan Amount |
|---|---|---|---|
| Open | Kennard Matthew S | $133,000 | |
| Previous Owner | Harrison Brian R | $121,043 |
Source: Public Records
Tax History Compared to Growth
Tax History
| Year | Tax Paid | Tax Assessment Tax Assessment Total Assessment is a certain percentage of the fair market value that is determined by local assessors to be the total taxable value of land and additions on the property. | Land | Improvement |
|---|---|---|---|---|
| 2024 | $2,869 | $75,470 | $15,780 | $59,690 |
| 2023 | $2,869 | $75,470 | $15,780 | $59,690 |
| 2022 | $2,801 | $63,880 | $15,020 | $48,860 |
| 2021 | $2,816 | $63,880 | $15,020 | $48,860 |
| 2020 | $2,890 | $63,880 | $15,020 | $48,860 |
| 2019 | $2,878 | $61,920 | $12,730 | $49,190 |
| 2018 | $2,862 | $61,920 | $12,730 | $49,190 |
| 2017 | $2,801 | $61,920 | $12,730 | $49,190 |
| 2016 | $1,923 | $44,210 | $10,310 | $33,900 |
| 2015 | $1,923 | $44,210 | $10,310 | $33,900 |
| 2014 | $1,887 | $44,210 | $10,310 | $33,900 |
| 2012 | $916 | $45,580 | $10,630 | $34,950 |
Source: Public Records
Map
Nearby Homes
- 7157 Ohio 98
- 7320 Fenner Rd
- 0 St Rt 61- Lot 2 Unit 9061433
- 6247 State Route 61 N
- 32 Brooks Ct
- 396 W Broadway St
- 143 Plymouth St
- 266 W Broadway St
- 2 Plum Creek Meadows
- 185 Broadway St
- 171 W Smiley Ave
- 24 Sunset Dr
- 84 Marvin Ave
- 65 Marvin Ave
- 34 Flint St
- 4265 State Route 61
- 83 2nd St
- 32 Sharon St
- 246 W Main St
- 62 Raymond Ave
- 5075 Preston Rd
- 5072 Preston Rd
- 5055 Preston Rd
- 7157 State Route 98
- 5162 Preston Rd
- 7251 State Route 98
- 5015 Preston Rd
- 7251 Ohio 98
- 5231 Preston Rd
- 7323 Fenner Rd
- 0 2 5 Acres Preston Rd
- 0 2 4 Acres Preston Rd
- 0 2 5 A Preston Rd
- 0 Preston Rd Lot#2
- 2 Preston Rd
- 0 Preston Rd
- 7115 State Route 98
- 7100 Ohio 98
- 7100 State Route 98
- 4945 Preston Rd