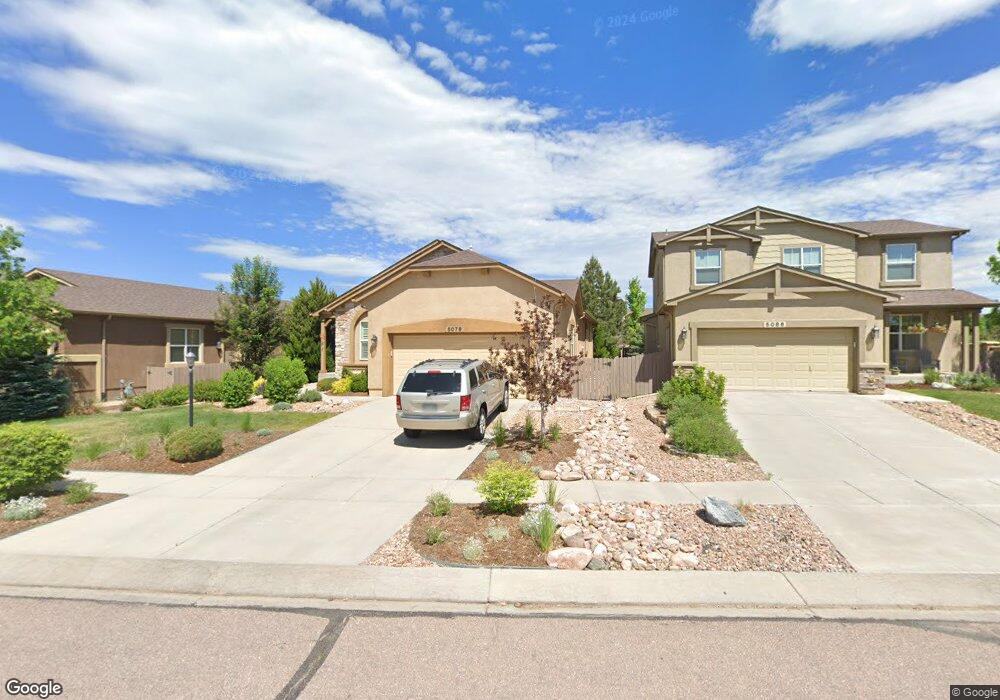
5078 Farris Creek Ct Colorado Springs, CO 80924
Wolf Ranch NeighborhoodEstimated Value: $627,000 - $639,000
4
Beds
3
Baths
1,462
Sq Ft
$433/Sq Ft
Est. Value
About This Home
This home is located at 5078 Farris Creek Ct, Colorado Springs, CO 80924 and is currently estimated at $633,199, approximately $433 per square foot. 5078 Farris Creek Ct is a home located in El Paso County with nearby schools including Chinook Trail Elementary School, Challenger Middle School, and Pine Creek High School.
Ownership History
Date
Name
Owned For
Owner Type
Purchase Details
Closed on
Sep 15, 2020
Sold by
5078 Farris Creek Ct Llc
Bought by
Bird David W and Bird Lora I
Current Estimated Value
Home Financials for this Owner
Home Financials are based on the most recent Mortgage that was taken out on this home.
Original Mortgage
$372,000
Outstanding Balance
$329,513
Interest Rate
2.8%
Mortgage Type
New Conventional
Estimated Equity
$303,686
Purchase Details
Closed on
Oct 8, 2015
Sold by
Vargas Pedro and Vargas Kimberly S
Bought by
5078 Farris Creek Ct Llc
Purchase Details
Closed on
Dec 5, 2007
Sold by
Keller Homes Inc
Bought by
Vargas Pedro and Vargas Kimberly S
Home Financials for this Owner
Home Financials are based on the most recent Mortgage that was taken out on this home.
Original Mortgage
$283,982
Interest Rate
6.27%
Mortgage Type
Unknown
Create a Home Valuation Report for This Property
The Home Valuation Report is an in-depth analysis detailing your home's value as well as a comparison with similar homes in the area
Home Values in the Area
Average Home Value in this Area
Purchase History
| Date | Buyer | Sale Price | Title Company |
|---|---|---|---|
| Bird David W | $465,000 | Heritage Title Company | |
| 5078 Farris Creek Ct Llc | -- | None Available | |
| Vargas Pedro | $354,978 | Land Title Guarantee Company |
Source: Public Records
Mortgage History
| Date | Status | Borrower | Loan Amount |
|---|---|---|---|
| Open | Bird David W | $372,000 | |
| Previous Owner | Vargas Pedro | $283,982 |
Source: Public Records
Tax History Compared to Growth
Tax History
| Year | Tax Paid | Tax Assessment Tax Assessment Total Assessment is a certain percentage of the fair market value that is determined by local assessors to be the total taxable value of land and additions on the property. | Land | Improvement |
|---|---|---|---|---|
| 2025 | $2,284 | $44,020 | -- | -- |
| 2024 | $2,257 | $41,890 | $8,040 | $33,850 |
| 2022 | $2,062 | $31,160 | $7,390 | $23,770 |
| 2021 | $2,435 | $32,050 | $7,600 | $24,450 |
| 2020 | $2,649 | $29,770 | $6,610 | $23,160 |
| 2019 | $2,625 | $29,770 | $6,610 | $23,160 |
| 2018 | $2,443 | $27,290 | $4,900 | $22,390 |
| 2017 | $2,435 | $27,290 | $4,900 | $22,390 |
| 2016 | $2,471 | $27,670 | $5,330 | $22,340 |
| 2015 | $2,467 | $27,670 | $5,330 | $22,340 |
| 2014 | $2,307 | $25,860 | $5,090 | $20,770 |
Source: Public Records
Map
Nearby Homes
- 5071 Farris Creek Ct
- 5019 Petrified Forest Trail
- 4895 Preachers Hollow Trail
- 5420 Paddington Creek Place
- 5480 Leon Young Dr
- The Denali Plan at The Townes at Cumbre Vista
- The Elbrus Plan at The Townes at Cumbre Vista
- The Vinson Plan at The Townes at Cumbre Vista
- The Everest Plan at The Townes at Cumbre Vista
- 9033 Kennebec Pass Trail
- 9613 Surrey Run Dr
- 5763 Thurber Dr
- 4658 Kashmire Dr
- 5218 Eldorado Canyon Ct
- 4652 Kashmire Dr
- 9436 Wolf Valley Dr
- 9426 Wolf Valley Dr
- 9484 Simper Heights
- 4545 Bays Water Dr
- 5747 Leon Young Dr
- 5070 Farris Creek Ct
- 5086 Farris Creek Ct
- 5062 Farris Creek Ct
- 4971 Rabbit Mountain Ct
- 4987 Rabbit Mountain Ct
- 5054 Farris Creek Ct
- 4963 Rabbit Mountain Ct
- 5079 Farris Creek Ct
- 5087 Farris Creek Ct
- 5046 Farris Creek Ct
- 4955 Rabbit Mountain Ct
- 5063 Farris Creek Ct
- 5055 Farris Creek Ct
- 4947 Rabbit Mountain Ct
- 5038 Farris Creek Ct
- 5047 Farris Creek Ct
- 9331 Lizard Rock Trail
- 4939 Rabbit Mountain Ct
- 5082 Petrified Forest Trail
- 5074 Petrified Forest Trail