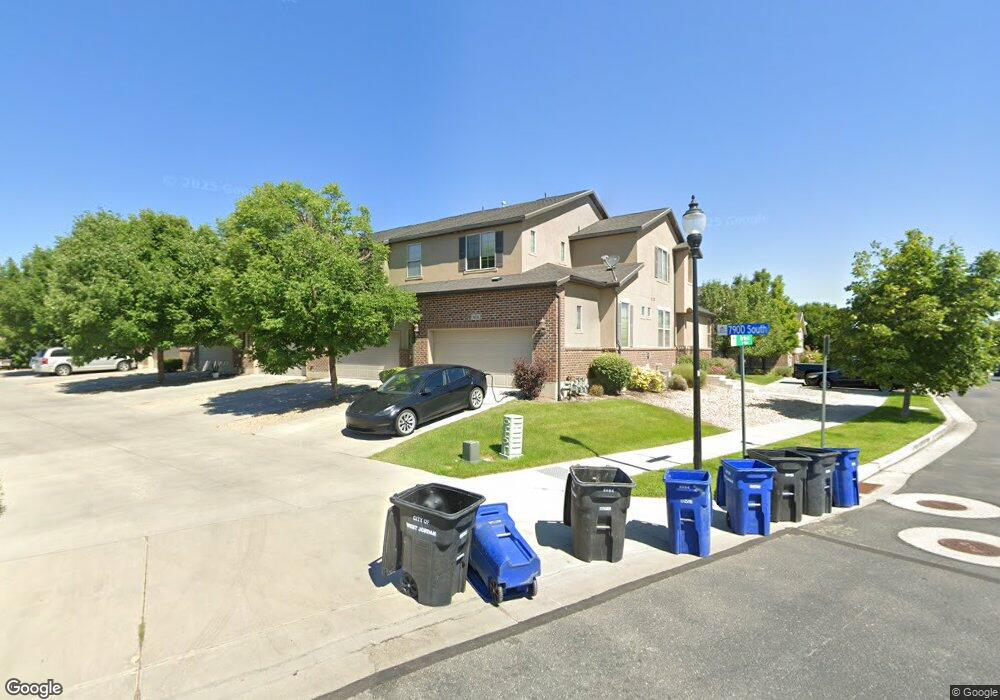
5078 W 7910 S West Jordan, UT 84081
Cobble Creek NeighborhoodEstimated Value: $441,000 - $465,000
3
Beds
3
Baths
2,433
Sq Ft
$185/Sq Ft
Est. Value
About This Home
This home is located at 5078 W 7910 S, West Jordan, UT 84081 and is currently estimated at $450,463, approximately $185 per square foot. 5078 W 7910 S is a home located in Salt Lake County with nearby schools including Hayden Peak Elementary School, West Hills Middle School, and Copper Hills High School.
Ownership History
Date
Name
Owned For
Owner Type
Purchase Details
Closed on
Mar 18, 2021
Sold by
Day Deann
Bought by
Day Deann and Deann Day Trust
Current Estimated Value
Purchase Details
Closed on
Jul 7, 2020
Sold by
Kellogg Thomas M and The Thomas M Kellogg Revocable
Bought by
Day Deann
Home Financials for this Owner
Home Financials are based on the most recent Mortgage that was taken out on this home.
Original Mortgage
$248,800
Outstanding Balance
$220,619
Interest Rate
3.1%
Mortgage Type
New Conventional
Estimated Equity
$229,844
Purchase Details
Closed on
Oct 29, 2015
Sold by
Bischoff John
Bought by
Kellogg Thomas Mcallister and Thomas Mcallister Kellogg Revocable Trus
Purchase Details
Closed on
Feb 26, 2013
Sold by
Ivory Towns Llc
Bought by
Bischoff John
Home Financials for this Owner
Home Financials are based on the most recent Mortgage that was taken out on this home.
Original Mortgage
$195,395
Interest Rate
3.25%
Mortgage Type
FHA
Create a Home Valuation Report for This Property
The Home Valuation Report is an in-depth analysis detailing your home's value as well as a comparison with similar homes in the area
Home Values in the Area
Average Home Value in this Area
Purchase History
| Date | Buyer | Sale Price | Title Company |
|---|---|---|---|
| Day Deann | -- | None Available | |
| Day Deann | -- | First American Title | |
| Kellogg Thomas Mcallister | -- | Stewart Title Ins Agcy Of Ut | |
| Bischoff John | -- | Cottonwood Title | |
| Ivory Towns Llc | -- | Cottonwood Title |
Source: Public Records
Mortgage History
| Date | Status | Borrower | Loan Amount |
|---|---|---|---|
| Open | Day Deann | $248,800 | |
| Previous Owner | Bischoff John | $195,395 |
Source: Public Records
Tax History Compared to Growth
Tax History
| Year | Tax Paid | Tax Assessment Tax Assessment Total Assessment is a certain percentage of the fair market value that is determined by local assessors to be the total taxable value of land and additions on the property. | Land | Improvement |
|---|---|---|---|---|
| 2025 | $2,187 | $427,200 | $69,400 | $357,800 |
| 2024 | $2,187 | $420,800 | $66,700 | $354,100 |
| 2023 | $2,187 | $382,400 | $64,200 | $318,200 |
| 2022 | $2,227 | $397,200 | $62,900 | $334,300 |
| 2021 | $1,973 | $320,400 | $48,400 | $272,000 |
| 2020 | $1,866 | $284,400 | $44,500 | $239,900 |
| 2019 | $1,793 | $268,000 | $42,000 | $226,000 |
| 2018 | $0 | $242,700 | $42,000 | $200,700 |
| 2017 | $1,619 | $239,000 | $42,000 | $197,000 |
| 2016 | $1,477 | $204,800 | $56,600 | $148,200 |
| 2015 | $1,536 | $207,600 | $63,300 | $144,300 |
| 2014 | $1,493 | $198,700 | $61,300 | $137,400 |
Source: Public Records
Map
Nearby Homes
- 7908 Cold Stone Ln Unit N3
- 7882 S Dove Creek Ln Unit A6
- 5189 W Dove Creek Ln
- 5183 W Swift Water Way
- 5228 W Ranches Loop Rd
- 5298 W Icehouse Way
- 7877 S 5440 W Unit 119
- 5422 W Island Creek Dr
- 4678 Emmons Dr
- 8322 Copper Vista Cir
- 7973 S Nebo Dr
- 7414 Regal Hill Dr
- 7903 Mckenzie Ln
- 7886 Mckenzie Ln
- 7563 S Opal Mountain Way W Unit 306
- 7567 S Opal Mountain Way W Unit 307
- 7556 S Opal Mountain Way W Unit 311
- 7569 S Opal Mountain Way W Unit 308
- 7554 S Opal Mountain Way W Unit 310
- 7553 S Opal Mountain Way W Unit 302
- 5074 W 7910 S
- 5084 W 7910 S
- 5086 W 7910 S
- 5092 W 7910 S
- 5079 W 7870 S
- 5073 W 7870 S
- 5083 W 7870 S Unit 218
- 5083 W 7870 S
- 5096 W 7910 S
- 5087 W 7870 S
- 7914 S Hartley Ln
- 7914 S Hartley Ln
- 5097 W 7870 S
- 7897 S Hartley Ln
- 7893 S Hartley Ln
- 7887 S Hartley Ln
- 7881 S Hartley Ln
- 7879 S Hartley Ln
- 7913 S Hartley Ln
- 7916 S Hartley Ln