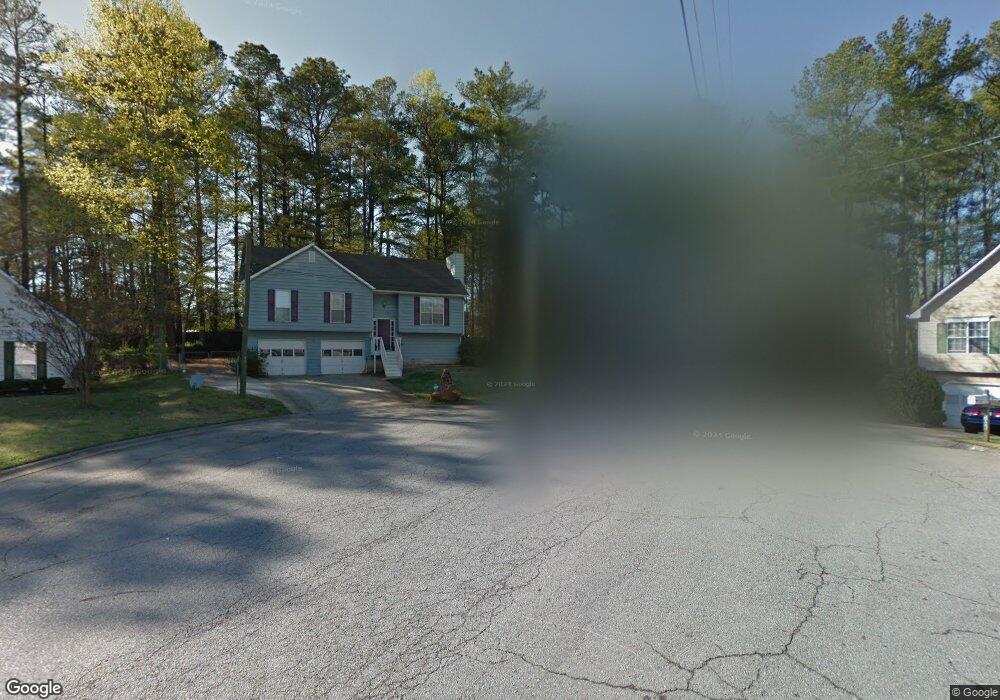
5079 Furlong Way Unit 3 Powder Springs, GA 30127
Estimated Value: $255,000 - $332,436
3
Beds
2
Baths
1,878
Sq Ft
$161/Sq Ft
Est. Value
About This Home
This home is located at 5079 Furlong Way Unit 3, Powder Springs, GA 30127 and is currently estimated at $302,609, approximately $161 per square foot. 5079 Furlong Way Unit 3 is a home located in Cobb County with nearby schools including Powder Springs Elementary School, Cooper Middle School, and McEachern High School.
Ownership History
Date
Name
Owned For
Owner Type
Purchase Details
Closed on
Sep 30, 2010
Sold by
Federal Home Loan Mortgage Corporation
Bought by
Owens Sheila R
Current Estimated Value
Home Financials for this Owner
Home Financials are based on the most recent Mortgage that was taken out on this home.
Original Mortgage
$82,417
Outstanding Balance
$57,271
Interest Rate
5.5%
Mortgage Type
FHA
Estimated Equity
$245,338
Purchase Details
Closed on
Mar 2, 2010
Sold by
Wells Fargo Bk Na
Bought by
Federal Home Loan Mortgage Corporation
Purchase Details
Closed on
Oct 31, 1997
Sold by
Lanier Eugene B and Lanier Cynthia G
Bought by
Wesley Hateezah C
Home Financials for this Owner
Home Financials are based on the most recent Mortgage that was taken out on this home.
Original Mortgage
$91,650
Interest Rate
7.27%
Mortgage Type
New Conventional
Create a Home Valuation Report for This Property
The Home Valuation Report is an in-depth analysis detailing your home's value as well as a comparison with similar homes in the area
Home Values in the Area
Average Home Value in this Area
Purchase History
| Date | Buyer | Sale Price | Title Company |
|---|---|---|---|
| Owens Sheila R | $90,000 | -- | |
| Federal Home Loan Mortgage Corporation | -- | -- | |
| Wells Fargo Bk Na | -- | -- | |
| Wesley Hateezah C | $94,500 | -- |
Source: Public Records
Mortgage History
| Date | Status | Borrower | Loan Amount |
|---|---|---|---|
| Open | Owens Sheila R | $82,417 | |
| Previous Owner | Wesley Hateezah C | $91,650 |
Source: Public Records
Tax History Compared to Growth
Tax History
| Year | Tax Paid | Tax Assessment Tax Assessment Total Assessment is a certain percentage of the fair market value that is determined by local assessors to be the total taxable value of land and additions on the property. | Land | Improvement |
|---|---|---|---|---|
| 2025 | $2,599 | $117,060 | $22,000 | $95,060 |
| 2024 | $2,677 | $120,532 | $22,000 | $98,532 |
| 2023 | $2,134 | $120,532 | $22,000 | $98,532 |
| 2022 | $2,130 | $94,560 | $10,000 | $84,560 |
| 2021 | $1,574 | $69,156 | $10,000 | $59,156 |
| 2020 | $1,458 | $63,840 | $10,000 | $53,840 |
| 2019 | $1,306 | $56,908 | $10,000 | $46,908 |
| 2018 | $1,306 | $56,908 | $10,000 | $46,908 |
| 2017 | $1,003 | $45,160 | $10,000 | $35,160 |
| 2016 | $1,005 | $45,160 | $10,000 | $35,160 |
| 2015 | $722 | $33,336 | $10,000 | $23,336 |
| 2014 | $518 | $26,256 | $0 | $0 |
Source: Public Records
Map
Nearby Homes
- 5076 Furlong Way
- 4740 Spring Gate Dr
- 3909 Brianna Dr
- 4607 Underwood Walk
- 4469 Caleb Crossing Unit 13
- 4721 Hill Rd
- 4970 Creekside Ln
- Kaufman Plan at Wildwood Place
- Brooks Plan at Wildwood Place
- Bryson Plan at Wildwood Place
- Bolton Plan at Wildwood Place
- 4492 Long St
- 4651 Larkfield Way
- 4517 Twinberry Dr
- 4525 Twinberry Dr
- 4586 Meadows Rd
- 4659 Larkfield Way
- 4667 Larkfield Way
- 4570 Meadows Rd
- 4671 Larkfield Way
- 5077 Furlong Way
- 5077 Furlong Way Unit 12
- 5080 Furlong Way
- 5075 Furlong Way
- 5078 Furlong Way
- 5072 Furlong Way
- 4251 Brownsville Rd
- 5073 Furlong Way
- 5068 Furlong Way
- 4755 Spring Gate Dr
- 5071 Furlong Way
- 4765 Spring Gate Dr
- 6262 Wager Ct Unit III
- 4745 Spring Gate Dr
- 5069 Furlong Way Unit 3
- 4775 Spring Gate Dr
- 6260 Wager Ct
- 6264 Wager Ct
- 4735 Spring Gate Dr
- 4785 Spring Gate Dr