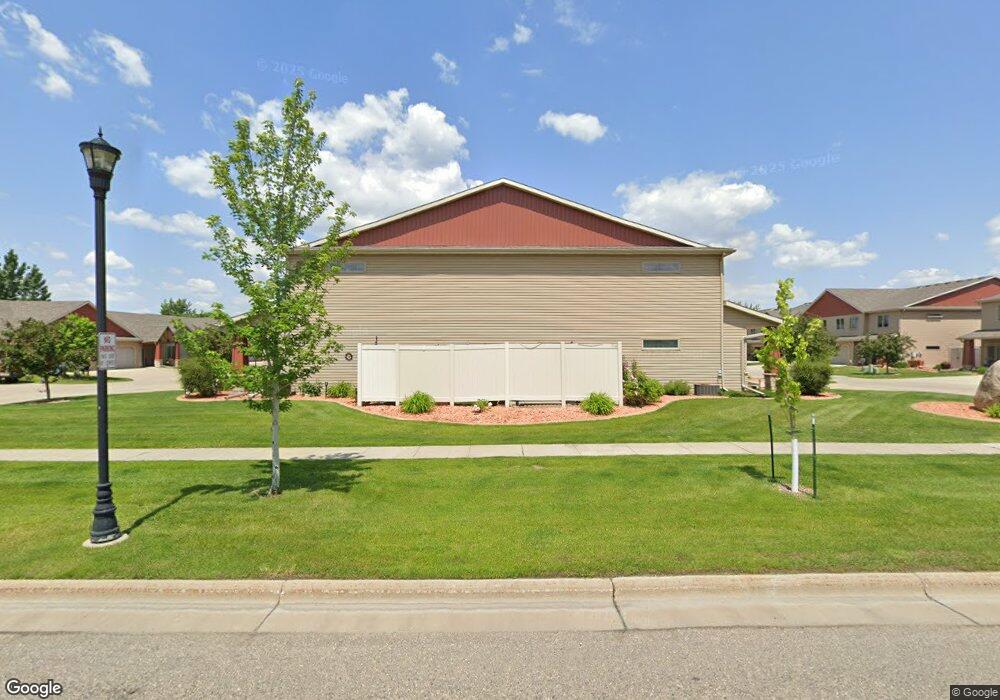
508 19 Ave W Unit C West Fargo, ND 56560
Elmwood Court NeighborhoodEstimated Value: $282,000 - $292,000
3
Beds
3
Baths
1,694
Sq Ft
$169/Sq Ft
Est. Value
About This Home
This home is located at 508 19 Ave W Unit C, West Fargo, ND 56560 and is currently estimated at $286,374, approximately $169 per square foot. 508 19 Ave W Unit C is a home located in Cass County with nearby schools including Westside Elementary School, Cheney Middle School, and West Fargo High School.
Ownership History
Date
Name
Owned For
Owner Type
Purchase Details
Closed on
Feb 28, 2022
Sold by
Roger Koth
Bought by
White Derrick J and Moody Tara
Current Estimated Value
Home Financials for this Owner
Home Financials are based on the most recent Mortgage that was taken out on this home.
Original Mortgage
$200,600
Outstanding Balance
$186,627
Interest Rate
3.55%
Mortgage Type
New Conventional
Estimated Equity
$99,747
Purchase Details
Closed on
Apr 6, 2018
Sold by
Carroll Corina
Bought by
Koth Roger
Purchase Details
Closed on
Aug 15, 2011
Sold by
Nester Mykal C
Bought by
Kraft Dennis B and Kraft Kathleen K
Home Financials for this Owner
Home Financials are based on the most recent Mortgage that was taken out on this home.
Original Mortgage
$107,200
Interest Rate
4.55%
Mortgage Type
New Conventional
Purchase Details
Closed on
Jul 14, 2006
Sold by
Elmwood Twonhomes Llc
Bought by
Nester Mykal C
Home Financials for this Owner
Home Financials are based on the most recent Mortgage that was taken out on this home.
Original Mortgage
$137,480
Interest Rate
6.72%
Mortgage Type
New Conventional
Create a Home Valuation Report for This Property
The Home Valuation Report is an in-depth analysis detailing your home's value as well as a comparison with similar homes in the area
Home Values in the Area
Average Home Value in this Area
Purchase History
| Date | Buyer | Sale Price | Title Company |
|---|---|---|---|
| White Derrick J | -- | Fm Title | |
| Koth Roger | $192,000 | Title Co | |
| Kraft Dennis B | $134,000 | None Available | |
| Nester Mykal C | -- | -- |
Source: Public Records
Mortgage History
| Date | Status | Borrower | Loan Amount |
|---|---|---|---|
| Open | White Derrick J | $200,600 | |
| Previous Owner | Kraft Dennis B | $107,200 | |
| Previous Owner | Nester Mykal C | $137,480 |
Source: Public Records
Tax History Compared to Growth
Tax History
| Year | Tax Paid | Tax Assessment Tax Assessment Total Assessment is a certain percentage of the fair market value that is determined by local assessors to be the total taxable value of land and additions on the property. | Land | Improvement |
|---|---|---|---|---|
| 2024 | $3,192 | $114,150 | $12,500 | $101,650 |
| 2023 | $3,060 | $108,800 | $12,500 | $96,300 |
| 2022 | $3,026 | $103,200 | $12,500 | $90,700 |
| 2021 | $3,040 | $99,000 | $10,000 | $89,000 |
| 2020 | $2,967 | $99,850 | $10,000 | $89,850 |
| 2019 | $2,842 | $97,250 | $10,000 | $87,250 |
| 2018 | $2,602 | $93,100 | $10,000 | $83,100 |
| 2017 | $2,970 | $89,950 | $10,000 | $79,950 |
| 2016 | $2,645 | $84,550 | $10,000 | $74,550 |
| 2015 | $2,805 | $83,400 | $5,400 | $78,000 |
| 2014 | $2,782 | $77,950 | $5,400 | $72,550 |
| 2013 | $2,765 | $77,950 | $5,400 | $72,550 |
Source: Public Records
Map
Nearby Homes
- 508 19 Ave W Unit F
- 508 19 Ave W Unit C
- 508 19 Ave W Unit G
- 508 19 Ave W
- 508 19 Ave W Unit H
- 508 19 Ave W Unit B
- 508 19 Ave W Unit A
- 508 19th Ave W Unit H
- 508 19th Ave W Unit F
- 508 19th Ave W Unit E
- 508 19th Ave W Unit B
- 508 19th Ave W Unit A
- 508 19th Ave W Unit D
- 508 19th Ave W
- 508 19th Ave W Unit G
- 508 19th Ave W Unit B
- 508 19th Ave W Unit G
- 508 19th Ave W Unit C
- 508 19th Ave W Unit A
- 508 19th Ave W Unit F