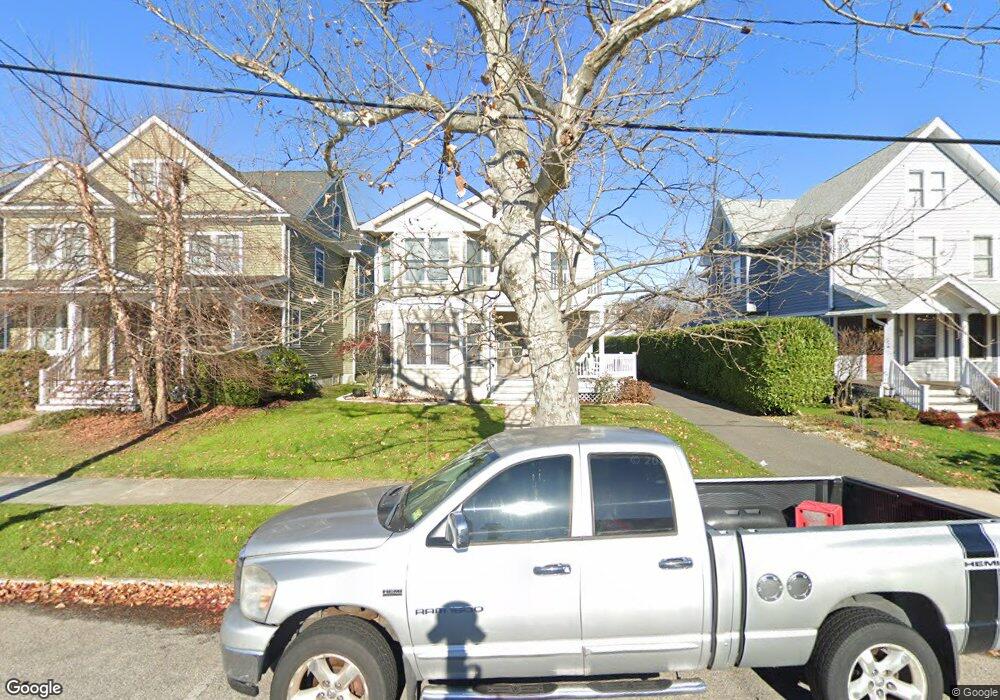
508 6th Ave Belmar, NJ 07719
Estimated Value: $1,729,724 - $2,059,000
4
Beds
1
Bath
2,830
Sq Ft
$669/Sq Ft
Est. Value
About This Home
This home is located at 508 6th Ave, Belmar, NJ 07719 and is currently estimated at $1,894,681, approximately $669 per square foot. 508 6th Ave is a home located in Monmouth County with nearby schools including Belmar Elementary School, St. Rose Grammar School, and St Rose High School.
Ownership History
Date
Name
Owned For
Owner Type
Purchase Details
Closed on
Jul 28, 2021
Sold by
E L Larsen Iii Building Contractor Llc
Bought by
Giudice Alexander P
Current Estimated Value
Home Financials for this Owner
Home Financials are based on the most recent Mortgage that was taken out on this home.
Original Mortgage
$481,600
Outstanding Balance
$437,924
Interest Rate
2.9%
Mortgage Type
New Conventional
Estimated Equity
$1,456,757
Purchase Details
Closed on
Feb 21, 2008
Sold by
Roussell Barbara A
Bought by
Roussell Barbara A and Austin Pamela M
Purchase Details
Closed on
Mar 3, 2006
Sold by
Malc Kenneth
Bought by
Roussell Maurice J and Roussell Barbara A
Create a Home Valuation Report for This Property
The Home Valuation Report is an in-depth analysis detailing your home's value as well as a comparison with similar homes in the area
Home Values in the Area
Average Home Value in this Area
Purchase History
| Date | Buyer | Sale Price | Title Company |
|---|---|---|---|
| Giudice Alexander P | $602,000 | Fidelity National Ttl Ins Co | |
| Roussell Barbara A | -- | None Available | |
| Roussell Maurice J | $985,000 | -- |
Source: Public Records
Mortgage History
| Date | Status | Borrower | Loan Amount |
|---|---|---|---|
| Open | Giudice Alexander P | $481,600 |
Source: Public Records
Tax History Compared to Growth
Tax History
| Year | Tax Paid | Tax Assessment Tax Assessment Total Assessment is a certain percentage of the fair market value that is determined by local assessors to be the total taxable value of land and additions on the property. | Land | Improvement |
|---|---|---|---|---|
| 2025 | $12,666 | $870,500 | $450,000 | $420,500 |
| 2024 | $12,239 | $870,500 | $450,000 | $420,500 |
| 2023 | $12,239 | $870,500 | $450,000 | $420,500 |
| 2022 | $10,761 | $870,500 | $450,000 | $420,500 |
| 2021 | $10,761 | $870,500 | $450,000 | $420,500 |
| 2020 | $11,708 | $870,500 | $450,000 | $420,500 |
| 2019 | $11,708 | $870,500 | $450,000 | $420,500 |
| 2018 | $10,751 | $870,500 | $450,000 | $420,500 |
| 2017 | $10,490 | $870,500 | $450,000 | $420,500 |
| 2016 | $11,772 | $616,000 | $205,000 | $411,000 |
| 2015 | $11,859 | $631,000 | $220,000 | $411,000 |
| 2014 | $11,049 | $571,000 | $200,000 | $371,000 |
Source: Public Records
Map
Nearby Homes