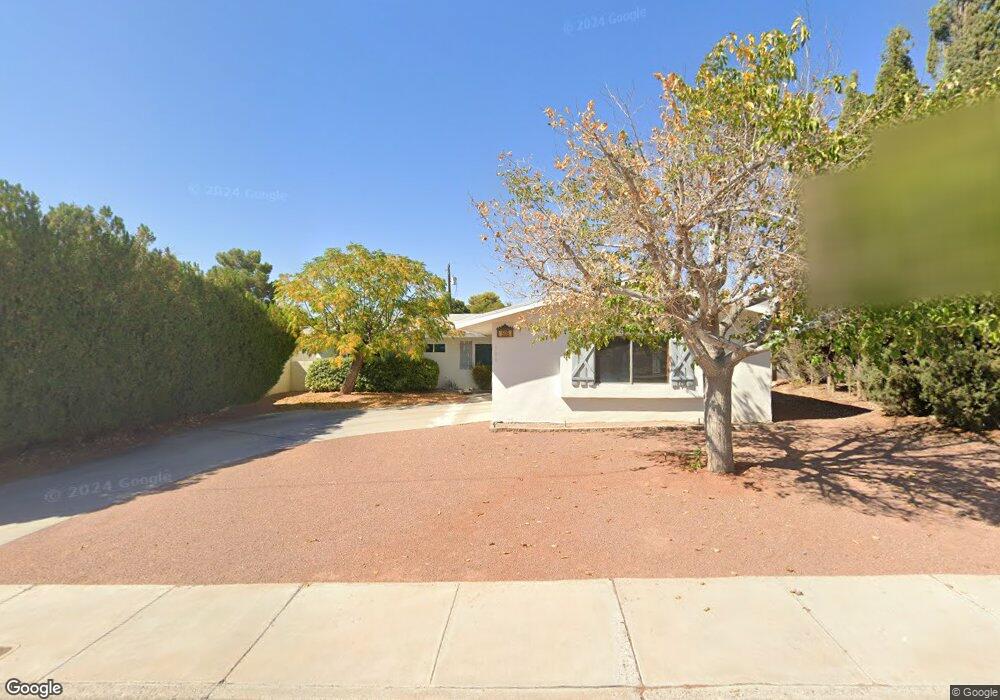
508 8th St Boulder City, NV 89005
Estimated Value: $354,000 - $440,000
4
Beds
2
Baths
1,310
Sq Ft
$315/Sq Ft
Est. Value
About This Home
This home is located at 508 8th St, Boulder City, NV 89005 and is currently estimated at $412,829, approximately $315 per square foot. 508 8th St is a home located in Clark County with nearby schools including Andrew Mitchell Elementary School, Martha P. King Elementary School, and Elton M. & Madelaine E. Garrett Junior High School.
Ownership History
Date
Name
Owned For
Owner Type
Purchase Details
Closed on
Apr 17, 1995
Sold by
Cook Jerry D and Cook Kelly A
Bought by
Thiesing Hadley J and Thiesing Marian G
Current Estimated Value
Home Financials for this Owner
Home Financials are based on the most recent Mortgage that was taken out on this home.
Original Mortgage
$124,200
Interest Rate
8.77%
Purchase Details
Closed on
Jan 31, 1995
Sold by
Kaiser Marguerite E
Bought by
Kaiser Marguerite E and Kaiser 1995 Trust
Create a Home Valuation Report for This Property
The Home Valuation Report is an in-depth analysis detailing your home's value as well as a comparison with similar homes in the area
Home Values in the Area
Average Home Value in this Area
Purchase History
| Date | Buyer | Sale Price | Title Company |
|---|---|---|---|
| Thiesing Hadley J | $138,000 | United Title | |
| Kaiser Marguerite E | -- | -- |
Source: Public Records
Mortgage History
| Date | Status | Borrower | Loan Amount |
|---|---|---|---|
| Closed | Thiesing Hadley J | $124,200 |
Source: Public Records
Tax History
| Year | Tax Paid | Tax Assessment Tax Assessment Total Assessment is a certain percentage of the fair market value that is determined by local assessors to be the total taxable value of land and additions on the property. | Land | Improvement |
|---|---|---|---|---|
| 2026 | $1,052 | $77,714 | $56,000 | $21,714 |
| 2025 | $1,021 | $74,121 | $52,500 | $21,621 |
| 2024 | $991 | $74,121 | $52,500 | $21,621 |
| 2023 | $991 | $59,367 | $39,900 | $19,467 |
| 2022 | $962 | $52,444 | $35,000 | $17,444 |
| 2021 | $934 | $45,947 | $29,750 | $16,197 |
| 2020 | $907 | $42,661 | $26,950 | $15,711 |
| 2019 | $881 | $40,018 | $24,850 | $15,168 |
| 2018 | $855 | $38,469 | $24,150 | $14,319 |
| 2017 | $920 | $35,225 | $21,000 | $14,225 |
| 2016 | $809 | $34,685 | $21,000 | $13,685 |
| 2015 | $807 | $30,774 | $17,500 | $13,274 |
| 2014 | $784 | $29,380 | $15,750 | $13,630 |
Source: Public Records
Map
Nearby Homes