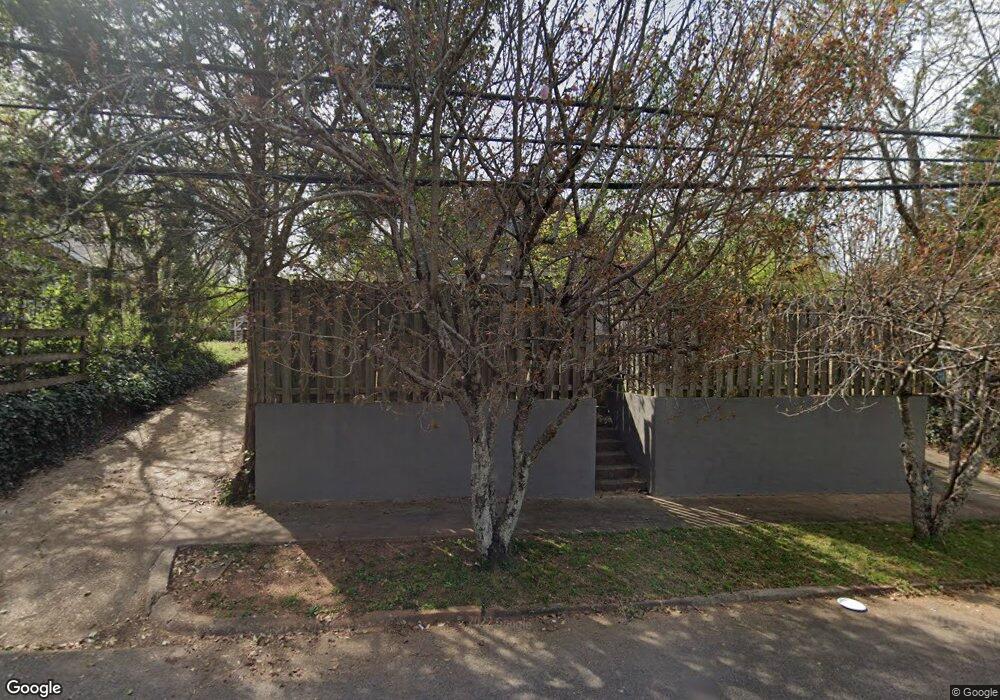
508 Alford St Lagrange, GA 30240
Estimated Value: $152,000 - $189,000
3
Beds
2
Baths
2,418
Sq Ft
$71/Sq Ft
Est. Value
About This Home
This home is located at 508 Alford St, Lagrange, GA 30240 and is currently estimated at $172,630, approximately $71 per square foot. 508 Alford St is a home located in Troup County with nearby schools including Ethel W. Kight Elementary School, Hollis Hand Elementary School, and Franklin Forest Elementary School.
Ownership History
Date
Name
Owned For
Owner Type
Purchase Details
Closed on
Oct 26, 1990
Sold by
Bergmann Lutz
Bought by
Lawley Cara J
Current Estimated Value
Purchase Details
Closed on
Aug 6, 1986
Sold by
Bergmann Renate C
Bought by
Bergmann Lutz
Purchase Details
Closed on
Mar 5, 1979
Sold by
Gold Ruth K
Bought by
Bergmann Renate C
Purchase Details
Closed on
Feb 24, 1979
Sold by
Kaminsky Richard M and Kaminsky Irene
Bought by
Gold Ruth K
Purchase Details
Closed on
Feb 23, 1979
Sold by
Kaminsky Richard M and Kaminsky Irene
Bought by
Kaminsky Richard M and Kaminsky Irene
Purchase Details
Closed on
Jun 22, 1978
Sold by
Kaminsky Mollie Ann
Bought by
Kaminsky Richard M and Kaminsky Irene
Purchase Details
Closed on
Jan 1, 1964
Sold by
Kaminsky Mollie
Bought by
Kaminsky Mollie Ann
Create a Home Valuation Report for This Property
The Home Valuation Report is an in-depth analysis detailing your home's value as well as a comparison with similar homes in the area
Home Values in the Area
Average Home Value in this Area
Purchase History
| Date | Buyer | Sale Price | Title Company |
|---|---|---|---|
| Lawley Cara J | $35,900 | -- | |
| Bergmann Lutz | -- | -- | |
| Bergmann Renate C | $19,000 | -- | |
| Gold Ruth K | -- | -- | |
| Kaminsky Richard M | -- | -- | |
| Kaminsky Richard M | -- | -- | |
| Kaminsky Mollie Ann | -- | -- |
Source: Public Records
Tax History Compared to Growth
Tax History
| Year | Tax Paid | Tax Assessment Tax Assessment Total Assessment is a certain percentage of the fair market value that is determined by local assessors to be the total taxable value of land and additions on the property. | Land | Improvement |
|---|---|---|---|---|
| 2024 | $935 | $36,280 | $3,560 | $32,720 |
| 2023 | $788 | $30,880 | $3,560 | $27,320 |
| 2022 | $755 | $29,040 | $3,560 | $25,480 |
| 2021 | $711 | $25,560 | $3,560 | $22,000 |
| 2020 | $711 | $25,560 | $3,560 | $22,000 |
| 2019 | $637 | $23,120 | $3,000 | $20,120 |
| 2018 | $637 | $23,120 | $3,000 | $20,120 |
| 2017 | $637 | $23,120 | $3,000 | $20,120 |
| 2016 | $681 | $24,548 | $3,000 | $21,548 |
| 2015 | $699 | $25,126 | $3,577 | $21,548 |
| 2014 | $666 | $23,991 | $3,577 | $20,414 |
| 2013 | -- | $25,500 | $3,512 | $21,988 |
Source: Public Records
Map
Nearby Homes
- 506 Alford St
- 510 Alford St Unit 510B
- 510 Alford St Unit 510A
- 510 Alford St
- 504 Alford St
- 502 Alford St
- 304 Wilkes St
- 300 Wilkes St
- 399 Ridge St
- 306 Wilkes St
- 500 Alford St
- 509 Boulevard
- 401 Ridge St
- 509 Alford St
- 507 Alford St
- 511 Alford St
- 505 Alford St
- 515 Boulevard
- 515 Boulevard Unit LT 8/ BLK F
- 513 Alford St