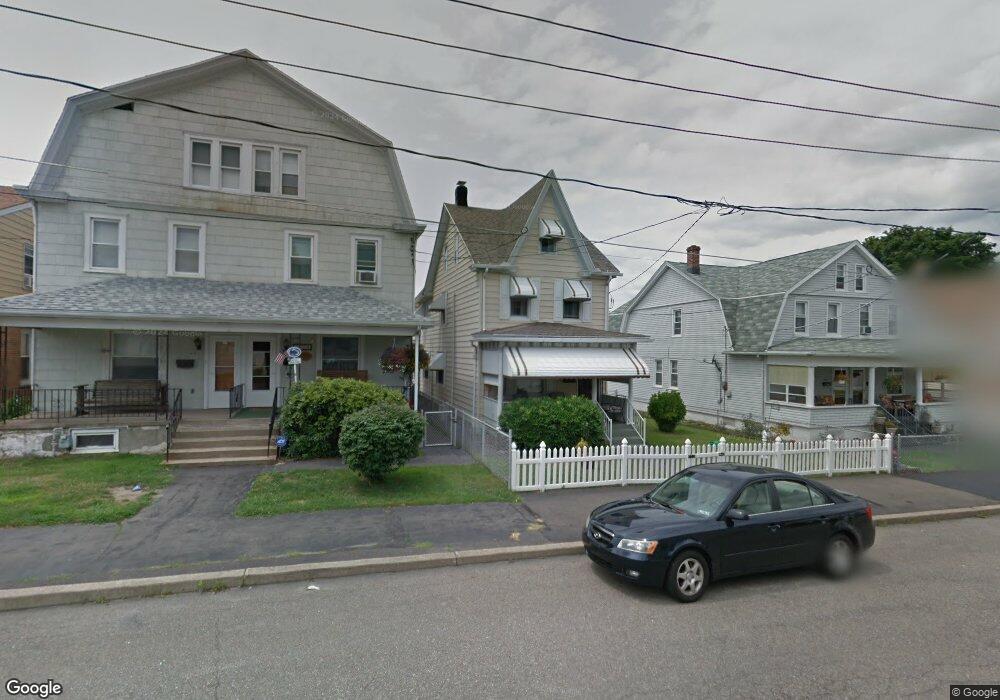
508 Allen St West Hazleton, PA 18202
Estimated Value: $196,325 - $231,000
--
Bed
--
Bath
1,680
Sq Ft
$128/Sq Ft
Est. Value
About This Home
This home is located at 508 Allen St, West Hazleton, PA 18202 and is currently estimated at $214,581, approximately $127 per square foot. 508 Allen St is a home located in Luzerne County with nearby schools including Hazleton Area High School, Immanuel Christian School, and Bishop Hafey Junior/Senior High School.
Ownership History
Date
Name
Owned For
Owner Type
Purchase Details
Closed on
Feb 2, 2018
Sold by
Smith Darren
Bought by
Sandrock Allen L and Fiore Kristy L
Current Estimated Value
Home Financials for this Owner
Home Financials are based on the most recent Mortgage that was taken out on this home.
Original Mortgage
$110,461
Outstanding Balance
$93,550
Interest Rate
3.99%
Mortgage Type
FHA
Estimated Equity
$121,031
Purchase Details
Closed on
Mar 6, 2015
Sold by
Smith Dorothy R
Bought by
Smith Darren
Purchase Details
Closed on
Mar 8, 1973
Bought by
Smith Donald and Smith Dorothy
Create a Home Valuation Report for This Property
The Home Valuation Report is an in-depth analysis detailing your home's value as well as a comparison with similar homes in the area
Home Values in the Area
Average Home Value in this Area
Purchase History
| Date | Buyer | Sale Price | Title Company |
|---|---|---|---|
| Sandrock Allen L | $112,500 | None Available | |
| Smith Darren | -- | None Available | |
| Smith Donald | $15,000 | -- |
Source: Public Records
Mortgage History
| Date | Status | Borrower | Loan Amount |
|---|---|---|---|
| Open | Sandrock Allen L | $110,461 |
Source: Public Records
Tax History Compared to Growth
Tax History
| Year | Tax Paid | Tax Assessment Tax Assessment Total Assessment is a certain percentage of the fair market value that is determined by local assessors to be the total taxable value of land and additions on the property. | Land | Improvement |
|---|---|---|---|---|
| 2025 | $2,462 | $97,600 | $22,200 | $75,400 |
| 2024 | $2,381 | $97,600 | $22,200 | $75,400 |
| 2023 | $2,319 | $97,600 | $22,200 | $75,400 |
| 2022 | $2,301 | $97,600 | $22,200 | $75,400 |
| 2021 | $2,244 | $97,600 | $22,200 | $75,400 |
| 2020 | $2,212 | $97,600 | $22,200 | $75,400 |
| 2019 | $1,322 | $97,600 | $22,200 | $75,400 |
| 2018 | $1,977 | $97,600 | $22,200 | $75,400 |
| 2017 | $1,942 | $97,600 | $22,200 | $75,400 |
| 2016 | -- | $97,600 | $22,200 | $75,400 |
| 2015 | $1,229 | $97,600 | $22,200 | $75,400 |
| 2014 | $1,229 | $97,600 | $22,200 | $75,400 |
Source: Public Records
Map
Nearby Homes