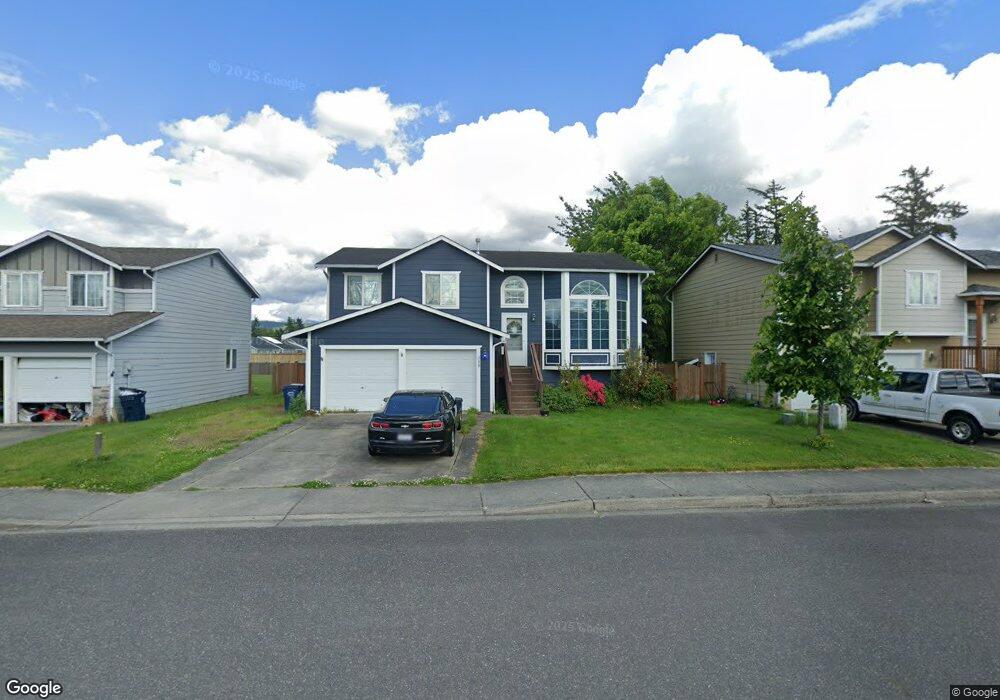
508 Allison Way Nooksack, WA 98276
Estimated Value: $510,000 - $564,000
4
Beds
4
Baths
1,758
Sq Ft
$300/Sq Ft
Est. Value
About This Home
This home is located at 508 Allison Way, Nooksack, WA 98276 and is currently estimated at $527,693, approximately $300 per square foot. 508 Allison Way is a home located in Whatcom County with nearby schools including Nooksack Elementary School, Everson Elementary School, and Sumas Elementary School.
Ownership History
Date
Name
Owned For
Owner Type
Purchase Details
Closed on
Jun 11, 2020
Sold by
Brown Eric P and Brown Alyssa R
Bought by
Hento Ryan and Hento Jennifer
Current Estimated Value
Home Financials for this Owner
Home Financials are based on the most recent Mortgage that was taken out on this home.
Original Mortgage
$365,690
Outstanding Balance
$324,156
Interest Rate
3.2%
Mortgage Type
New Conventional
Estimated Equity
$203,537
Purchase Details
Closed on
Apr 21, 2009
Sold by
Lenssen Troy and Lenssen Jamie
Bought by
Brown Eric P and Brown Alyssa R
Home Financials for this Owner
Home Financials are based on the most recent Mortgage that was taken out on this home.
Original Mortgage
$211,105
Interest Rate
5.02%
Mortgage Type
FHA
Purchase Details
Closed on
Mar 1, 2006
Sold by
Burch Daniel W and Burch Edee
Bought by
Himalaya Homes Inc
Home Financials for this Owner
Home Financials are based on the most recent Mortgage that was taken out on this home.
Original Mortgage
$2,633,750
Interest Rate
6.18%
Mortgage Type
Unknown
Create a Home Valuation Report for This Property
The Home Valuation Report is an in-depth analysis detailing your home's value as well as a comparison with similar homes in the area
Home Values in the Area
Average Home Value in this Area
Purchase History
| Date | Buyer | Sale Price | Title Company |
|---|---|---|---|
| Hento Ryan | $377,000 | Chicago Title Company Of Wa | |
| Brown Eric P | $215,280 | Chicago Title Insurance | |
| Himalaya Homes Inc | $3,762,780 | First American Title Insuran |
Source: Public Records
Mortgage History
| Date | Status | Borrower | Loan Amount |
|---|---|---|---|
| Open | Hento Ryan | $365,690 | |
| Previous Owner | Brown Eric P | $211,105 | |
| Previous Owner | Himalaya Homes Inc | $2,633,750 |
Source: Public Records
Tax History Compared to Growth
Tax History
| Year | Tax Paid | Tax Assessment Tax Assessment Total Assessment is a certain percentage of the fair market value that is determined by local assessors to be the total taxable value of land and additions on the property. | Land | Improvement |
|---|---|---|---|---|
| 2024 | $4,024 | $474,557 | $180,000 | $294,557 |
| 2023 | $4,024 | $448,391 | $137,744 | $310,647 |
| 2022 | $3,689 | $403,964 | $124,096 | $279,868 |
| 2021 | $3,427 | $333,858 | $102,560 | $231,298 |
| 2020 | $3,289 | $271,436 | $83,384 | $188,052 |
| 2019 | $2,782 | $271,436 | $83,384 | $188,052 |
| 2018 | $3,047 | $260,420 | $80,000 | $180,420 |
| 2017 | $2,730 | $212,683 | $63,800 | $148,883 |
| 2016 | $2,611 | $196,261 | $58,850 | $137,411 |
| 2015 | $2,226 | $188,307 | $56,760 | $131,547 |
| 2014 | -- | $182,468 | $55,000 | $127,468 |
| 2013 | -- | $182,468 | $55,000 | $127,468 |
Source: Public Records
Map
Nearby Homes
- 705 E 5th St
- 412 W 3rd St
- 404 W 3rd St
- 308 W 3rd St
- 304 W 3rd St
- 107 S Pass Rd Unit 14
- 107 S Pass Rd Unit 23
- 409 Amareen Ct
- 109 W 2nd St
- 201 Brentwood Dr
- 1204 E Georgia Ln
- 7554 Nooksack Rd
- 207 E Main St
- 108 Baker St Unit 1-4
- 205 Reeds Ln Unit 64
- 404 W 4th St
- 400 W 4th St
- 405 W 4th St
- 409 W 4th St
- 325 W 4th St
- 508 Allison Way
- 506 Allison Way
- 510 Allison Way
- 504 Allison Way
- 512 Allison Way
- 502 Allison Way
- 514 Allison Way
- 507 Allison Way
- 509 Allison Way
- 408 E Madison St
- 505 Allison Way
- 511 Allison Way
- 416 Allison Way
- 503 Allison Way
- 412 E Madison St
- 513 Allison Way
- 414 Allison Way
- 501 Allison Way
- 416 E Madison St
- 508 E 2nd St