Estimated Value: $241,000 - $255,000
3
Beds
2
Baths
1,647
Sq Ft
$152/Sq Ft
Est. Value
About This Home
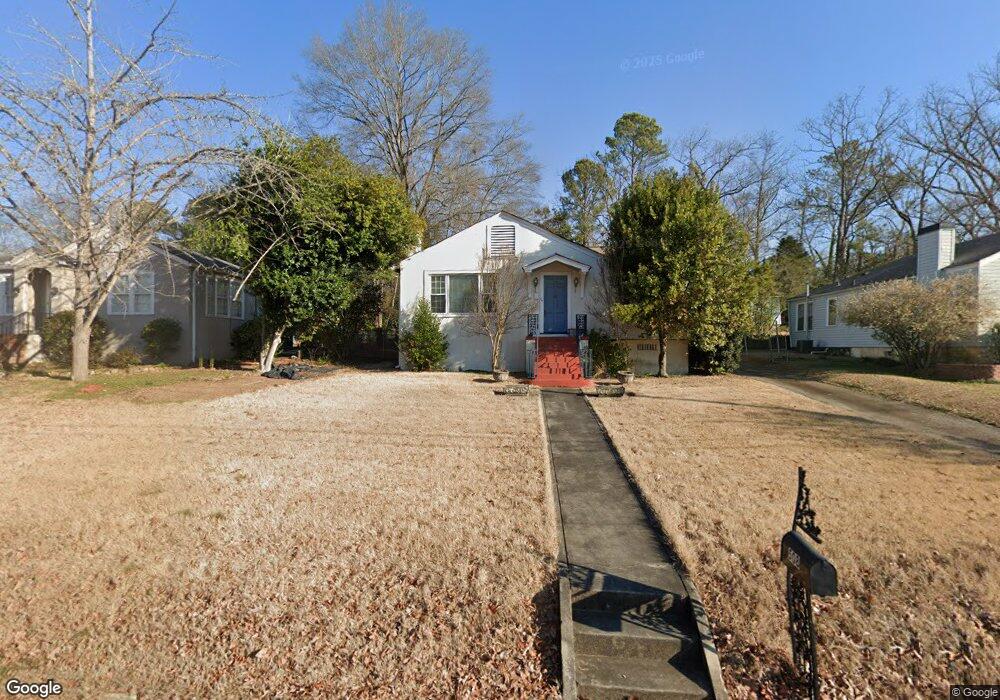
This home is located at 508 Charlton St NW, Rome, GA 30165 and is currently estimated at $250,111, approximately $151 per square foot. 508 Charlton St NW is a home located in Floyd County with nearby schools including Rome High School.
Ownership History
Date
Name
Owned For
Owner Type
Purchase Details
Closed on
Jun 20, 2017
Sold by
Burton Karen Dee
Bought by
Langford Chanda L and Langford William L
Current Estimated Value
Purchase Details
Closed on
May 1, 2009
Bought by
P and R
Purchase Details
Closed on
Dec 21, 1995
Sold by
Browder Walter Frederick and Browder Elizabeth C
Bought by
Crider Karen D
Purchase Details
Closed on
Dec 20, 1995
Bought by
P and R
Purchase Details
Closed on
Sep 14, 1995
Bought by
P and R
Purchase Details
Closed on
Jun 28, 1992
Sold by
Browder Walter F and Browder Elizabeth C
Bought by
Browder Walter Frederick and Browder Elizabet
Purchase Details
Closed on
Aug 22, 1986
Sold by
King Merle S and King Cheryl W
Bought by
Browder Walter F and Brow Elizabeth C
Purchase Details
Closed on
Aug 14, 1980
Sold by
Diprima Stella C
Bought by
King Merle S and King Cheryl W
Purchase Details
Closed on
Oct 2, 1968
Sold by
Diprima Norman
Bought by
Diprima Stella C
Purchase Details
Closed on
Jan 1, 1950
Sold by
Diprima Norman
Bought by
Diprima Norman
Purchase Details
Closed on
Jan 1, 1901
Bought by
Diprima Norman
Create a Home Valuation Report for This Property
The Home Valuation Report is an in-depth analysis detailing your home's value as well as a comparison with similar homes in the area
Home Values in the Area
Average Home Value in this Area
Purchase History
| Date | Buyer | Sale Price | Title Company |
|---|---|---|---|
| Langford Chanda L | $123,000 | -- | |
| P | -- | -- | |
| Crider Karen D | $47,500 | -- | |
| P | -- | -- | |
| P | -- | -- | |
| Browder Walter Frederick | -- | -- | |
| Browder Walter F | $47,700 | -- | |
| King Merle S | $41,500 | -- | |
| Diprima Stella C | -- | -- | |
| Diprima Norman | -- | -- | |
| Diprima Norman | -- | -- |
Source: Public Records
Tax History Compared to Growth
Tax History
| Year | Tax Paid | Tax Assessment Tax Assessment Total Assessment is a certain percentage of the fair market value that is determined by local assessors to be the total taxable value of land and additions on the property. | Land | Improvement |
|---|---|---|---|---|
| 2024 | $2,039 | $104,130 | $12,241 | $91,889 |
| 2023 | $1,708 | $86,448 | $11,128 | $75,320 |
| 2022 | $1,530 | $72,245 | $9,181 | $63,064 |
| 2021 | $1,440 | $65,978 | $9,181 | $56,797 |
| 2020 | $1,372 | $61,183 | $6,955 | $54,228 |
| 2019 | $1,249 | $55,265 | $6,955 | $48,310 |
| 2018 | $1,076 | $52,665 | $6,955 | $45,710 |
| 2017 | $1,669 | $45,082 | $6,955 | $38,127 |
| 2016 | $1,646 | $44,336 | $6,920 | $37,416 |
| 2015 | $1,391 | $44,336 | $6,920 | $37,416 |
| 2014 | $1,391 | $44,336 | $6,920 | $37,416 |
Source: Public Records
Map
Nearby Homes
- 614 Briarwood Cir NW
- 204 Oakwood St NW
- 7 Raymond Ave NW
- 208 Dodd St NW
- 808 Charlton St NW
- 105 Robin St NW
- 0 Unbridled Rd Unit 22 23074684
- 4 Colonial Dr NW
- 124 Sheridan Dr NW
- 209 Sherwood Rd SW
- 9 Shorter Cir SW
- 23 Sweetspire Dr NW
- 21 Sweetspire Dr NW
- 15 Silverbell Ln
- 8 S Hughes St SW
- 1005 N 2nd Ave NW Unit 39
- PEARSON Plan at Shorter Village
- 3 Berckman Ln SW
- 506 Charlton St NW
- 512 Charlton St NW
- 504 Charlton St NW
- 23 Vineland Dr NW
- 7 Vineland Dr NW
- 514 Charlton St NW
- 9 Vineland Dr NW
- 5 Vineland Dr NW
- 513 Charlton St NW
- 511 Charlton St NW
- 11 Vineland Dr NW
- 517 Charlton St NW
- 1 Vineland Dr NW
- 519 Charlton St NW
- 15 Vineland Dr NW
- 509 Charlton St NW
- 521 Charlton St NW
- 523 Charlton St NW
- 0 Charlton St NW Unit 8583290
- 0 Charlton St NW Unit 8521067