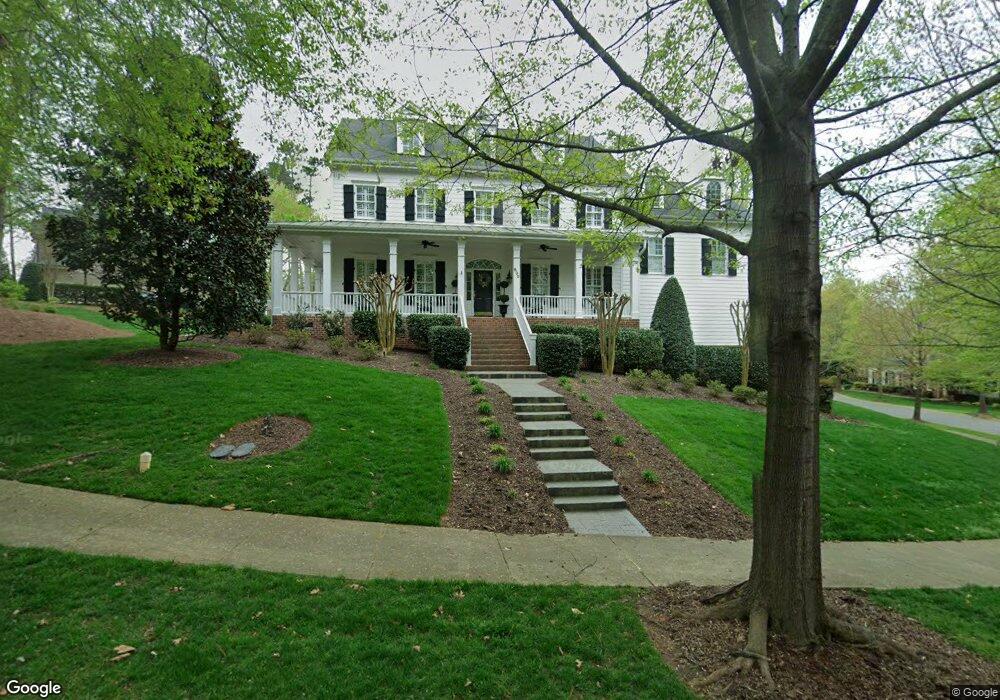
508 Chrismill Ln Holly Springs, NC 27540
Estimated Value: $961,000 - $1,315,000
4
Beds
4
Baths
3,512
Sq Ft
$330/Sq Ft
Est. Value
About This Home
This home is located at 508 Chrismill Ln, Holly Springs, NC 27540 and is currently estimated at $1,158,090, approximately $329 per square foot. 508 Chrismill Ln is a home located in Wake County with nearby schools including Holly Springs Elementary School, Holly Ridge Middle School, and Holly Springs High School.
Ownership History
Date
Name
Owned For
Owner Type
Purchase Details
Closed on
Apr 7, 2023
Sold by
Mahar Daniel John and Mahar Melissa F
Bought by
Mahar Living Trust and Mahar
Current Estimated Value
Purchase Details
Closed on
Jan 4, 2012
Sold by
Mahar Melissa F
Bought by
Mahar Melissa F and Mahar Daniel J
Home Financials for this Owner
Home Financials are based on the most recent Mortgage that was taken out on this home.
Original Mortgage
$495,000
Interest Rate
4.06%
Mortgage Type
VA
Purchase Details
Closed on
May 31, 2007
Sold by
Djf Builders Inc
Bought by
Mahar Melissa F
Home Financials for this Owner
Home Financials are based on the most recent Mortgage that was taken out on this home.
Original Mortgage
$61,990
Interest Rate
6.16%
Mortgage Type
Credit Line Revolving
Create a Home Valuation Report for This Property
The Home Valuation Report is an in-depth analysis detailing your home's value as well as a comparison with similar homes in the area
Home Values in the Area
Average Home Value in this Area
Purchase History
| Date | Buyer | Sale Price | Title Company |
|---|---|---|---|
| Mahar Living Trust | -- | None Listed On Document | |
| Mahar Melissa F | -- | None Available | |
| Mahar Melissa F | $620,000 | None Available |
Source: Public Records
Mortgage History
| Date | Status | Borrower | Loan Amount |
|---|---|---|---|
| Previous Owner | Mahar Melissa F | $495,000 | |
| Previous Owner | Mahar Melissa F | $61,990 | |
| Previous Owner | Mahar Melissa F | $495,920 |
Source: Public Records
Tax History Compared to Growth
Tax History
| Year | Tax Paid | Tax Assessment Tax Assessment Total Assessment is a certain percentage of the fair market value that is determined by local assessors to be the total taxable value of land and additions on the property. | Land | Improvement |
|---|---|---|---|---|
| 2025 | -- | $1,128,048 | $155,000 | $973,048 |
| 2024 | $9,687 | $1,128,048 | $155,000 | $973,048 |
| 2023 | $8,286 | $766,326 | $95,000 | $671,326 |
| 2022 | $7,998 | $766,326 | $95,000 | $671,326 |
| 2021 | $7,849 | $766,326 | $95,000 | $671,326 |
| 2020 | $7,849 | $766,326 | $95,000 | $671,326 |
| 2019 | $7,872 | $652,578 | $75,000 | $577,578 |
| 2018 | $7,113 | $652,578 | $75,000 | $577,578 |
| 2017 | $6,856 | $652,578 | $75,000 | $577,578 |
| 2016 | $6,761 | $652,578 | $75,000 | $577,578 |
| 2015 | $7,283 | $692,079 | $110,000 | $582,079 |
| 2014 | -- | $692,079 | $110,000 | $582,079 |
Source: Public Records
Map
Nearby Homes
- 208 Apple Drupe Way
- 116 Cobblebrook Ct
- 305 Wellspring Dr
- 204 Chrismill Ln
- 112 Sanchez Ct
- 5620 Lockley Rd
- 112 Midden Way
- 138 Cobalt Creek Way
- 228 Masden Rd
- 204 Leafgate Ct
- 213 Capello Ct
- 0 Old Ride Dr
- 225 Old Ride Dr
- 109 Willow View Ln
- 208 Old Ride Dr
- 329 N Main St
- 217 Jones Hill Rd
- 425 Arbor Creek Dr
- 413 Rhamkatte Rd
- 1539 N Main St
- 504 Chrismill Ln
- 512 Chrismill Ln
- 517 Chrismill Ln
- 513 Chrismill Ln
- 509 Chrismill Ln
- 529 Chrismill Ln
- 1100 Crossway Ln
- 533 Chrismill Ln
- 1104 Crossway Ln
- 525 Chrismill Ln
- 505 Chrismill Ln
- 1108 Crossway Ln
- 1008 Crossway Ln
- 501 Chrismill Ln
- 1017 Skymont Dr
- 1013 Skymont Dr
- 1112 Crossway Ln
- 1021 Skymont Dr
- 1009 Skymont Dr
- 116 Holly Glade Cir