508 Connie Dr Lagrange, GA 30240
Estimated Value: $213,000 - $225,308
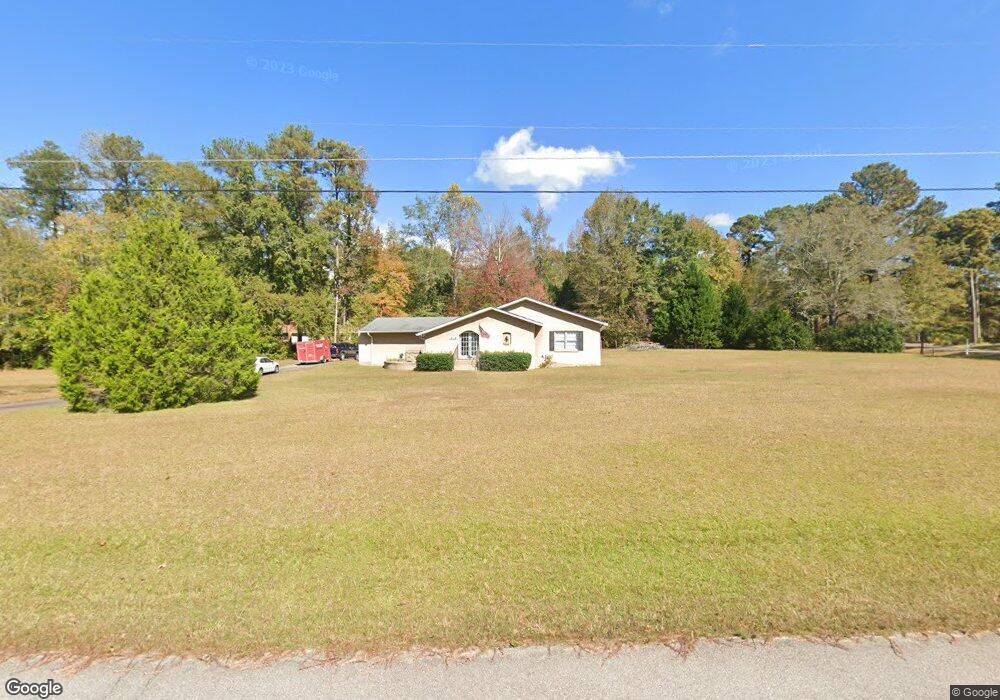
About This Home
This home is located at 508 Connie Dr, Lagrange, GA 30240 and is currently estimated at $219,827, approximately $123 per square foot. 508 Connie Dr is a home located in Troup County with nearby schools including Berta Weathersbee Elementary School, Long Cane Elementary School, and Whitesville Road Elementary School.
Ownership History
We collect this data history from publicly available records. To have your information removed, we recommend requesting removal directly through your county’s website.
Purchase Details
Home Financials for this Owner
Home Financials are based on the most recent Mortgage that was taken out on this home.Purchase Details
Purchase Details
Purchase Details
Purchase Details
Purchase Details
Purchase Details
Purchase History
We collect this data history from publicly available records. To have your information removed, we recommend requesting removal directly through your county’s website.
| Date | Buyer | Sale Price | Title Company |
|---|---|---|---|
| $188,000 | -- | ||
| -- | -- | ||
| -- | -- | ||
| -- | -- | ||
| $37,500 | -- | ||
| $3,100 | -- | ||
| -- | -- |
Mortgage History
We collect this data history from publicly available records. To have your information removed, we recommend requesting removal directly through your county’s website.
| Date | Status | Borrower | Loan Amount |
|---|---|---|---|
| Open | $178,600 |
Tax History
We collect this data history from publicly available records. To have your information removed, we recommend requesting removal directly through your county’s website.
| Year | Tax Paid | Tax Assessment Tax Assessment Total Assessment is a certain percentage of the fair market value that is determined by local assessors to be the total taxable value of land and additions on the property. | Land | Improvement |
|---|---|---|---|---|
| 2025 | $2,120 | $77,732 | $10,000 | $67,732 |
| 2024 | $1,286 | $76,200 | $10,000 | $66,200 |
| 2023 | $1,179 | $72,280 | $8,000 | $64,280 |
| 2022 | $1,108 | $68,320 | $8,000 | $60,320 |
| 2021 | $772 | $54,320 | $8,000 | $46,320 |
| 2020 | $1,338 | $54,320 | $8,000 | $46,320 |
| 2019 | $992 | $42,840 | $4,200 | $38,640 |
| 2018 | $884 | $39,280 | $4,200 | $35,080 |
| 2017 | $884 | $39,280 | $4,200 | $35,080 |
| 2016 | $866 | $38,652 | $4,200 | $34,452 |
| 2015 | $866 | $38,652 | $4,200 | $34,452 |
| 2014 | $811 | $36,838 | $4,200 | $32,638 |
| 2013 | -- | $38,960 | $4,200 | $34,760 |
Map
- 419 Fling Rd
- 245 Teaver Rd
- 53 Horace Carter Rd
- 36 Hill Rd
- 20 Hill Rd
- 0 Bradfield Dr Unit 10568803
- 62 Maley Rd
- 227 W Lakeview Dr
- 3658 W Point Rd
- 129 Angela East Dr
- 105 + - Acres On McCosh Mill Rd
- 4.51 ACRES Whatley Rd N
- 0 Deming St Unit 10550189
- 104 Spring Valley Dr
- 300 Cheyenne Dr
- 0 Unit 10514554
- 203 Shawnee Dr
- 6 Hastings Ct
- 82 Newton Rd
- 105 Redwood Dr
Ask me questions while you tour the home.