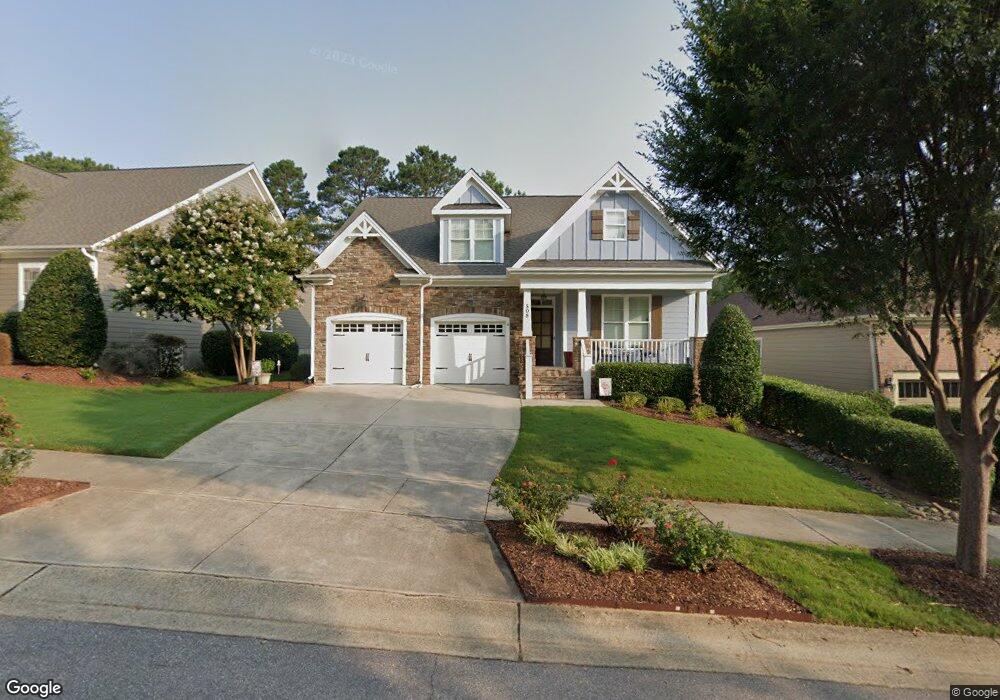
508 Dimock Way Wake Forest, NC 27587
Estimated Value: $496,241 - $621,000
3
Beds
3
Baths
2,005
Sq Ft
$293/Sq Ft
Est. Value
About This Home
This home is located at 508 Dimock Way, Wake Forest, NC 27587 and is currently estimated at $587,060, approximately $292 per square foot. 508 Dimock Way is a home located in Wake County with nearby schools including Heritage Elementary School, Heritage Middle School, and Heritage High School.
Ownership History
Date
Name
Owned For
Owner Type
Purchase Details
Closed on
Jun 27, 2018
Sold by
Khan Zeba
Bought by
Khan Zeba and Lamb Victoria
Current Estimated Value
Purchase Details
Closed on
Sep 27, 2012
Sold by
Freeman Jonathan R and Freeman Emily
Bought by
Khan Zeba
Home Financials for this Owner
Home Financials are based on the most recent Mortgage that was taken out on this home.
Original Mortgage
$199,998
Outstanding Balance
$135,922
Interest Rate
3.12%
Mortgage Type
New Conventional
Estimated Equity
$451,138
Purchase Details
Closed on
Mar 5, 2012
Sold by
Braswell Custom Homes Inc
Bought by
Freeman Jonathan R and Freeman Emily
Home Financials for this Owner
Home Financials are based on the most recent Mortgage that was taken out on this home.
Original Mortgage
$180,000
Interest Rate
4%
Mortgage Type
New Conventional
Purchase Details
Closed on
May 6, 2011
Sold by
Heritage Wake Forest Inc
Bought by
Braswell Custom Homes Inc
Create a Home Valuation Report for This Property
The Home Valuation Report is an in-depth analysis detailing your home's value as well as a comparison with similar homes in the area
Home Values in the Area
Average Home Value in this Area
Purchase History
| Date | Buyer | Sale Price | Title Company |
|---|---|---|---|
| Khan Zeba | -- | None Available | |
| Khan Zeba | $285,000 | None Available | |
| Freeman Jonathan R | $284,500 | None Available | |
| Braswell Custom Homes Inc | $50,000 | None Available |
Source: Public Records
Mortgage History
| Date | Status | Borrower | Loan Amount |
|---|---|---|---|
| Open | Khan Zeba | $199,998 | |
| Previous Owner | Freeman Jonathan R | $180,000 |
Source: Public Records
Tax History
| Year | Tax Paid | Tax Assessment Tax Assessment Total Assessment is a certain percentage of the fair market value that is determined by local assessors to be the total taxable value of land and additions on the property. | Land | Improvement |
|---|---|---|---|---|
| 2025 | $5,033 | $539,032 | $100,000 | $439,032 |
| 2024 | $5,173 | $539,032 | $100,000 | $439,032 |
Source: Public Records
Map
Nearby Homes
- 1317 Plunket Dr
- 504 Walters Dr
- 401 Hammond Oak Ln
- 404 Vodin St
- 520 Hallburg Ct
- 1009 Binkley Chapel Ct
- 516 Clifton Blue St
- 1020 Sun Springs Rd
- 111 Stone Park Dr
- 685 Sun Meadow Dr
- 681 Sun Meadow Dr
- 677 Sun Meadow Dr
- 1623 Main Divide Dr
- 123 Stone Park Dr
- 621 Sun Meadow Dr
- 1121 Touchstone Way
- 1015 Wait Ave
- 1108 Sun Springs Rd
- 1212 Sky Hill Place
- 504 Sun Meadow Dr
- 504 Dimock Way
- 512 Dimock Way
- 500 Dimock Way
- 516 Dimock Way
- 1312 Vanagrif Ct
- 1308 Vanagrif Ct
- 424 Dimock Way
- 520 Dimock Way
- 509 Dimock Way
- 1320 Vanagrif Ct
- 513 Dimock Way
- 1304 Vanagrif Ct
- 517 Dimock Way
- 420 Dimock Way
- 1404 Basley St
- 524 Dimock Way
- 521 Dimock Way
- 1328 Vanagrif Ct
- 1300 Vanagrif Ct
- 1408 Basley St
Your Personal Tour Guide
Ask me questions while you tour the home.