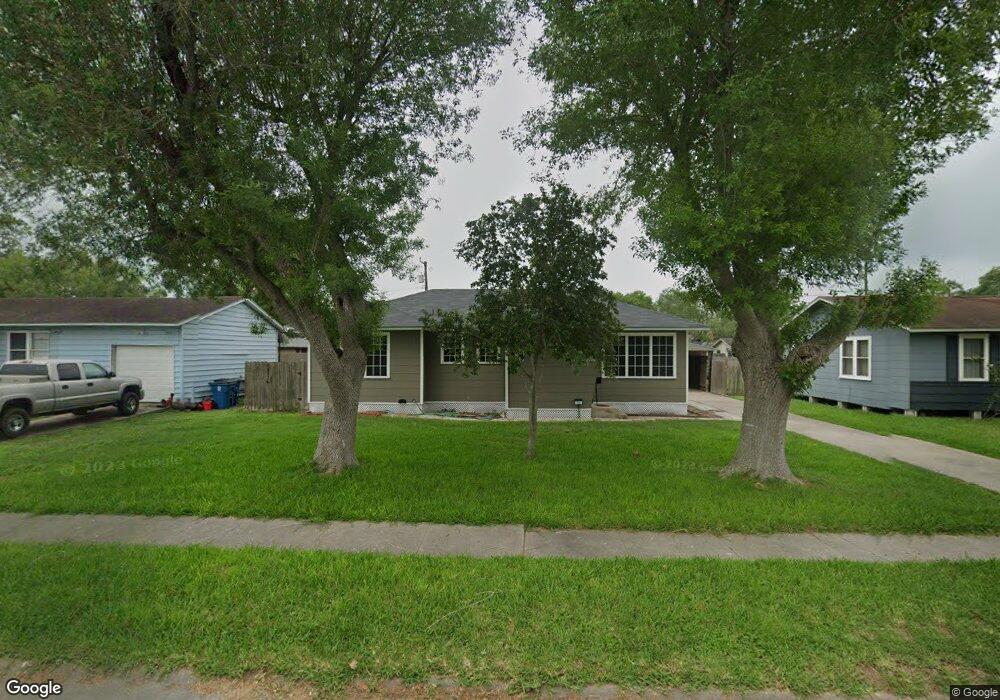
508 E 9th St Bishop, TX 78343
Estimated Value: $128,000 - $170,000
Studio
--
Bath
1,275
Sq Ft
$117/Sq Ft
Est. Value
About This Home
This home is located at 508 E 9th St, Bishop, TX 78343 and is currently estimated at $149,663, approximately $117 per square foot. 508 E 9th St is a home located in Nueces County with nearby schools including Bishop High School and St Paul Lutheran School.
Ownership History
Date
Name
Owned For
Owner Type
Purchase Details
Closed on
Oct 7, 2025
Sold by
Ramirez Lawrence and Ramirez Tracy A
Bought by
Rizo Maria Guadalupe
Current Estimated Value
Purchase Details
Closed on
Apr 1, 2019
Sold by
Sims Gordon A and Sims Cathy S
Bought by
Suarez Luis
Home Financials for this Owner
Home Financials are based on the most recent Mortgage that was taken out on this home.
Original Mortgage
$92,121
Interest Rate
4.3%
Mortgage Type
New Conventional
Purchase Details
Closed on
Nov 21, 2011
Sold by
Hanna Frances D
Bought by
Sims Gordon A and Sims Cathy S
Home Financials for this Owner
Home Financials are based on the most recent Mortgage that was taken out on this home.
Original Mortgage
$63,352
Interest Rate
4.25%
Mortgage Type
FHA
Create a Home Valuation Report for This Property
The Home Valuation Report is an in-depth analysis detailing your home's value as well as a comparison with similar homes in the area
Home Values in the Area
Average Home Value in this Area
Purchase History
| Date | Buyer | Sale Price | Title Company |
|---|---|---|---|
| Rizo Maria Guadalupe | -- | None Listed On Document | |
| Suarez Luis | -- | None Available | |
| Sims Gordon A | -- | None Available |
Source: Public Records
Mortgage History
| Date | Status | Borrower | Loan Amount |
|---|---|---|---|
| Previous Owner | Suarez Luis | $92,121 | |
| Previous Owner | Sims Gordon A | $63,352 |
Source: Public Records
Tax History
| Year | Tax Paid | Tax Assessment Tax Assessment Total Assessment is a certain percentage of the fair market value that is determined by local assessors to be the total taxable value of land and additions on the property. | Land | Improvement |
|---|---|---|---|---|
| 2025 | $1,293 | $126,782 | -- | -- |
| 2024 | $2,671 | $115,256 | $0 | $0 |
| 2023 | $1,192 | $104,778 | $0 | $0 |
| 2022 | $2,355 | $95,253 | $10,080 | $85,173 |
| 2021 | $2,370 | $90,220 | $10,080 | $80,140 |
| 2020 | $2,399 | $84,361 | $10,080 | $74,281 |
| 2019 | $2,565 | $86,645 | $10,080 | $76,565 |
| 2018 | $2,513 | $88,616 | $10,080 | $78,536 |
| 2017 | $2,252 | $80,976 | $10,080 | $70,896 |
| 2016 | $2,149 | $101,358 | $10,080 | $91,278 |
Source: Public Records
Map
Nearby Homes
Your Personal Tour Guide
Ask me questions while you tour the home.