Estimated Value: $971,000 - $1,135,000
3
Beds
2
Baths
1,189
Sq Ft
$881/Sq Ft
Est. Value
About This Home
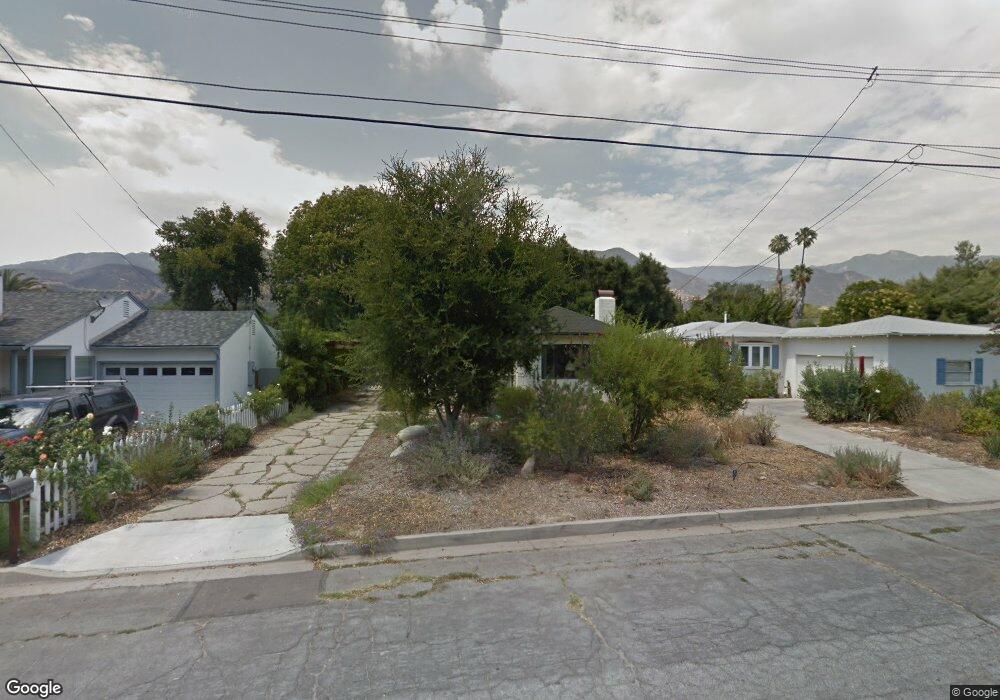
This home is located at 508 E Aliso St, Ojai, CA 93023 and is currently estimated at $1,046,962, approximately $880 per square foot. 508 E Aliso St is a home located in Ventura County with nearby schools including Topa Topa Elementary School, Meiners Oaks Elementary School, and Matilija Junior High.
Ownership History
Date
Name
Owned For
Owner Type
Purchase Details
Closed on
Oct 6, 2021
Sold by
Bahu Carrie Grace
Bought by
Carrie Grace Bahu Separate Property Trus and Stanley
Current Estimated Value
Purchase Details
Closed on
Mar 5, 2021
Sold by
Bahu Carrie Grace
Bought by
Bahu Carrie Grace and Carrie Grace Bahu Trust
Purchase Details
Closed on
Jan 6, 2006
Sold by
Justin Peter
Bought by
Bahu Carrie Grace
Home Financials for this Owner
Home Financials are based on the most recent Mortgage that was taken out on this home.
Original Mortgage
$52,500
Interest Rate
6.15%
Mortgage Type
Credit Line Revolving
Create a Home Valuation Report for This Property
The Home Valuation Report is an in-depth analysis detailing your home's value as well as a comparison with similar homes in the area
Home Values in the Area
Average Home Value in this Area
Purchase History
| Date | Buyer | Sale Price | Title Company |
|---|---|---|---|
| Carrie Grace Bahu Separate Property Trus | -- | -- | |
| Bahu Carrie Grace | -- | None Available | |
| Bahu Carrie Grace | $525,000 | Southland Title Ventura |
Source: Public Records
Mortgage History
| Date | Status | Borrower | Loan Amount |
|---|---|---|---|
| Previous Owner | Bahu Carrie Grace | $52,500 | |
| Previous Owner | Bahu Carrie Grace | $420,000 |
Source: Public Records
Tax History
| Year | Tax Paid | Tax Assessment Tax Assessment Total Assessment is a certain percentage of the fair market value that is determined by local assessors to be the total taxable value of land and additions on the property. | Land | Improvement |
|---|---|---|---|---|
| 2025 | $11,890 | $990,425 | $644,048 | $346,377 |
| 2024 | $11,890 | $971,005 | $631,419 | $339,586 |
| 2023 | $11,482 | $951,966 | $619,038 | $332,928 |
| 2022 | $11,302 | $933,300 | $606,900 | $326,400 |
| 2021 | $8,428 | $662,806 | $561,814 | $100,992 |
| 2020 | $8,223 | $656,011 | $556,054 | $99,957 |
| 2019 | $7,984 | $643,149 | $545,151 | $97,998 |
| 2018 | $7,908 | $630,539 | $534,462 | $96,077 |
| 2017 | $7,757 | $618,177 | $523,983 | $94,194 |
| 2016 | $5,442 | $436,000 | $366,000 | $70,000 |
| 2015 | $5,845 | $471,000 | $395,000 | $76,000 |
| 2014 | $5,511 | $463,000 | $388,000 | $75,000 |
Source: Public Records
Map
Nearby Homes
- 310 E Matilija St
- 608 E Ojai Ave
- 203 N Fulton St
- 216 N Fulton St
- 401 S Fulton St
- 207 E Eucalyptus St
- 211 Fox St
- 211 N Signal St
- 915 E Matilija St
- 0 N Ventura Unit TR25015633
- 325 Bryant St
- 408 Canada St
- 309 S Signal St
- 113 S Blanche St
- 901 Grandview Ave
- 0 E Ojai Ave Unit 224929
- 0 E Ojai Ave Unit V1-33149
- 300 W Santa Ana St
- 1214 Gregory St
- 810 Libby Ave
Your Personal Tour Guide
Ask me questions while you tour the home.