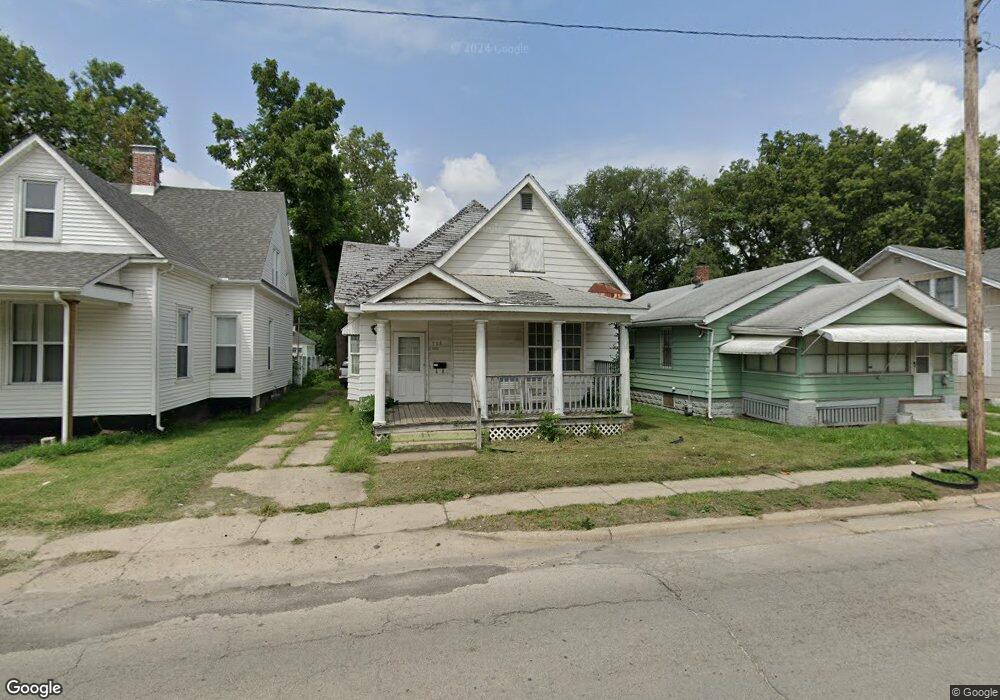
508 E Grand Ave Decatur, IL 62521
Martin Luther King NeighborhoodEstimated Value: $27,000 - $61,000
--
Bed
--
Bath
1,232
Sq Ft
$38/Sq Ft
Est. Value
About This Home
This home is located at 508 E Grand Ave, Decatur, IL 62521 and is currently estimated at $47,226, approximately $38 per square foot. 508 E Grand Ave is a home located in Macon County with nearby schools including Hope Academy.
Ownership History
Date
Name
Owned For
Owner Type
Purchase Details
Closed on
Apr 25, 2023
Sold by
Pirlle Staci
Bought by
Euler Ciara
Current Estimated Value
Purchase Details
Closed on
Dec 8, 2021
Sold by
Pirtle Danny
Bought by
Pirtle Staci
Purchase Details
Closed on
Jul 9, 2014
Sold by
Hoopkingarner Wesley E
Bought by
Pirtle Danny L
Purchase Details
Closed on
Dec 6, 2012
Sold by
Tally Terrence A and Tally Roberta E
Bought by
Hoopingarner Wesley E
Purchase Details
Closed on
Nov 6, 2012
Sold by
Ballinger Dennis D
Bought by
Tally Terrence A and Tally Roberta E
Purchase Details
Closed on
Aug 25, 2010
Sold by
Bean Stephen M
Bought by
Ballinger Dennis D
Purchase Details
Closed on
Jun 20, 2005
Sold by
Abn Amro Mortgage Group Inc
Bought by
Aliabadi Massoud
Purchase Details
Closed on
Sep 1, 2004
Sold by
Federal Home Loan Mortgage Corporation
Bought by
Abn Amro Mortgage Group Inc
Purchase Details
Closed on
Nov 1, 2002
Create a Home Valuation Report for This Property
The Home Valuation Report is an in-depth analysis detailing your home's value as well as a comparison with similar homes in the area
Home Values in the Area
Average Home Value in this Area
Purchase History
| Date | Buyer | Sale Price | Title Company |
|---|---|---|---|
| Euler Ciara | -- | None Listed On Document | |
| Pirtle Staci | -- | None Listed On Document | |
| Pirtle Danny L | -- | None Available | |
| Hoopingarner Wesley E | -- | None Available | |
| Tally Terrence A | $5,000 | None Available | |
| Ballinger Dennis D | -- | None Available | |
| Aliabadi Massoud | -- | None Available | |
| Abn Amro Mortgage Group Inc | -- | None Available | |
| -- | $35,000 | -- |
Source: Public Records
Tax History Compared to Growth
Tax History
| Year | Tax Paid | Tax Assessment Tax Assessment Total Assessment is a certain percentage of the fair market value that is determined by local assessors to be the total taxable value of land and additions on the property. | Land | Improvement |
|---|---|---|---|---|
| 2024 | $364 | $5,766 | $437 | $5,329 |
| 2023 | $374 | $5,562 | $422 | $5,140 |
| 2022 | $385 | $5,294 | $390 | $4,904 |
| 2021 | $509 | $4,944 | $365 | $4,579 |
| 2020 | $400 | $4,715 | $349 | $4,366 |
| 2019 | $400 | $4,715 | $349 | $4,366 |
| 2018 | $395 | $5,044 | $177 | $4,867 |
| 2017 | $394 | $5,179 | $182 | $4,997 |
| 2016 | $398 | $5,232 | $184 | $5,048 |
| 2015 | $385 | $5,140 | $181 | $4,959 |
| 2014 | $492 | $5,089 | $179 | $4,910 |
| 2013 | $504 | $5,280 | $186 | $5,094 |
Source: Public Records
Map
Nearby Homes
- 141 E Packard St
- 1558 N Main St
- 1568 N Main St
- 240 E Olive St
- 1458 N Union St
- 1245 N Union St
- 1135 E Locust St
- 1459 N Jasper St
- 844 N Edward St
- 12 East Dr
- 216 W Garfield Ave
- 230 W Garfield Ave
- 415 W Green St
- 1504 N Monroe St
- 1545 N Monroe St
- 644 W Division St
- 1437 E Division St
- 875 N Monroe St
- 837 W Grand Ave
- 1915 N Monroe St
- 466 E Grand Ave
- 516 E Grand Ave
- 526 E Grand Ave
- 528 E Grand Ave
- 536 E Grand Ave
- 521 E Grand Ave Unit AVE00000
- 546 E Grand Ave
- 523 E Waggoner St
- 437 E Waggoner St
- 537 E Waggoner St
- 428 E Grand Ave
- 433 E Waggoner St
- 501 N East Ave
- 543 E Waggoner St
- 541 E Grand Ave Unit AVE00000
- 471 E Grand Ave Unit AVE00000
- 429 E Waggoner St
- 581 E Grand Ave Unit AVE00000
- 1306 N Warren St
- 431 E Grand Ave Unit AVE00000