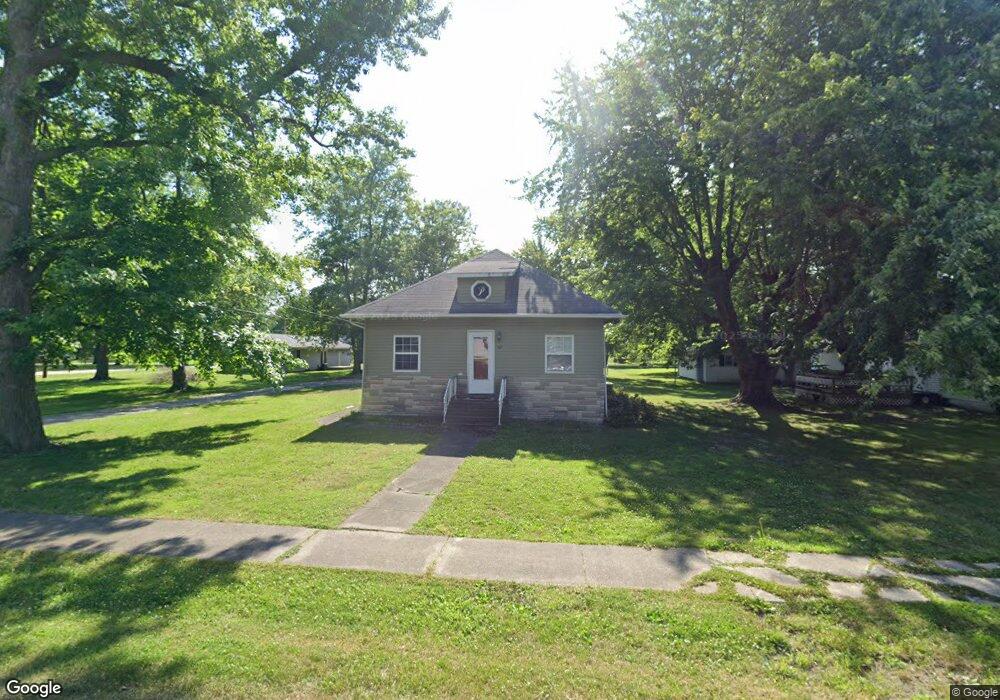
508 East St Taylor Springs, IL 62089
Estimated Value: $78,000 - $124,000
--
Bed
--
Bath
1,383
Sq Ft
$65/Sq Ft
Est. Value
About This Home
This home is located at 508 East St, Taylor Springs, IL 62089 and is currently estimated at $89,690, approximately $64 per square foot. 508 East St is a home with nearby schools including Hillsboro High School.
Ownership History
Date
Name
Owned For
Owner Type
Purchase Details
Closed on
Aug 8, 2023
Sold by
Lemon John C and Lemon Jonita M
Bought by
Hanner Kaydi J
Current Estimated Value
Home Financials for this Owner
Home Financials are based on the most recent Mortgage that was taken out on this home.
Original Mortgage
$47,000
Outstanding Balance
$45,757
Interest Rate
6%
Mortgage Type
New Conventional
Estimated Equity
$43,933
Purchase Details
Closed on
Sep 30, 2022
Sold by
Pocklington John H E
Bought by
Lemon John C and Lemon Jonita M
Home Financials for this Owner
Home Financials are based on the most recent Mortgage that was taken out on this home.
Original Mortgage
$45,000
Interest Rate
5.13%
Mortgage Type
New Conventional
Purchase Details
Closed on
Aug 16, 2016
Sold by
Page Timothy R and Depage Shawne De
Bought by
Pocklington John H E
Home Financials for this Owner
Home Financials are based on the most recent Mortgage that was taken out on this home.
Original Mortgage
$45,000
Interest Rate
3.48%
Mortgage Type
New Conventional
Create a Home Valuation Report for This Property
The Home Valuation Report is an in-depth analysis detailing your home's value as well as a comparison with similar homes in the area
Home Values in the Area
Average Home Value in this Area
Purchase History
| Date | Buyer | Sale Price | Title Company |
|---|---|---|---|
| Hanner Kaydi J | $55,000 | Community Title | |
| Lemon John C | $15,000 | Community Title | |
| Pocklington John H E | $50,000 | -- |
Source: Public Records
Mortgage History
| Date | Status | Borrower | Loan Amount |
|---|---|---|---|
| Open | Hanner Kaydi J | $47,000 | |
| Previous Owner | Lemon John C | $45,000 | |
| Previous Owner | Pocklington John H E | $45,000 |
Source: Public Records
Tax History Compared to Growth
Tax History
| Year | Tax Paid | Tax Assessment Tax Assessment Total Assessment is a certain percentage of the fair market value that is determined by local assessors to be the total taxable value of land and additions on the property. | Land | Improvement |
|---|---|---|---|---|
| 2024 | $1,727 | $28,160 | $1,250 | $26,910 |
| 2023 | $2,119 | $25,860 | $1,150 | $24,710 |
| 2022 | $1,510 | $24,210 | $1,080 | $23,130 |
| 2021 | $1,384 | $22,190 | $990 | $21,200 |
| 2020 | $1,352 | $21,710 | $970 | $20,740 |
| 2019 | $1,265 | $20,320 | $910 | $19,410 |
| 2018 | $1,118 | $18,580 | $830 | $17,750 |
| 2017 | $1,238 | $19,320 | $860 | $18,460 |
| 2016 | $1,249 | $20,090 | $890 | $19,200 |
| 2015 | $1,312 | $20,900 | $930 | $19,970 |
| 2013 | $1,216 | $20,480 | $910 | $19,570 |
Source: Public Records
Map
Nearby Homes
- 316 Mill Ln
- 1910 Washington St
- 200 W Kinkead Rd
- 0 Illinois 185
- 1310 Vandalia Rd
- 402 W Mechanic St
- 217 W Fairground Ave
- 808 Smith Ln
- 523 E Tremont St
- 631 Lakeview Dr
- 632 Jefferson St
- 425 Rountree St
- 508 E Wood St
- 123 N East St
- 136 N Hamilton St
- 220 N Grant St
- 238 N Main St
- 58 N Woods Cir
- 509 Locust St
- 141 Lakecrest Ln