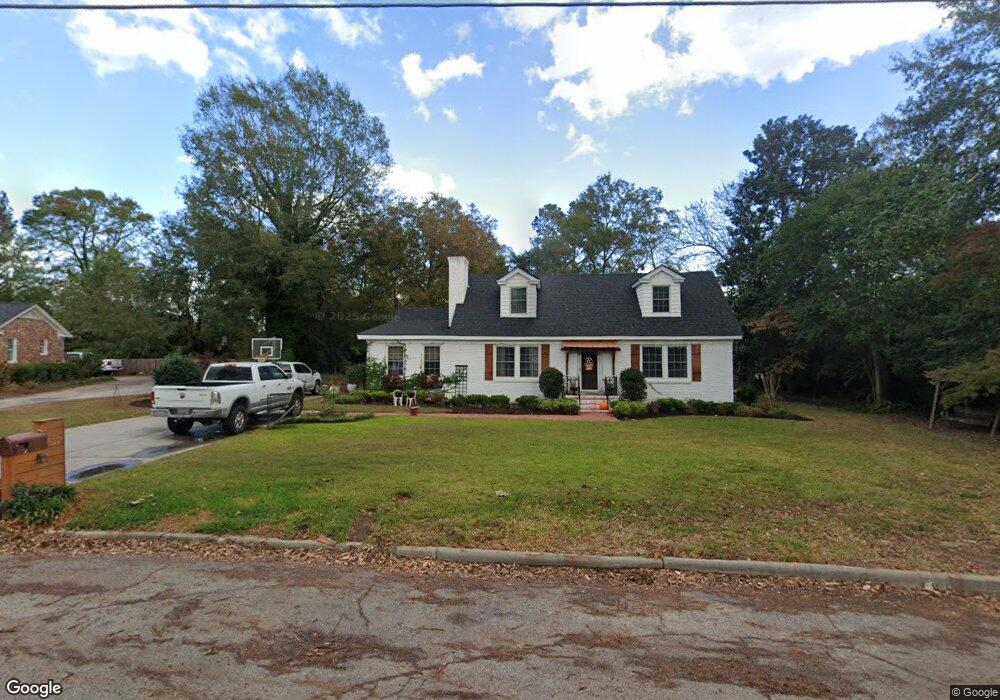
508 Forrest Dr Waynesboro, GA 30830
Estimated Value: $265,265 - $372,000
4
Beds
3
Baths
2,268
Sq Ft
$137/Sq Ft
Est. Value
About This Home
This home is located at 508 Forrest Dr, Waynesboro, GA 30830 and is currently estimated at $309,816, approximately $136 per square foot. 508 Forrest Dr is a home located in Burke County with nearby schools including Burke County High School, Burkehaven Christian School, and Edmund Burke Academy.
Ownership History
Date
Name
Owned For
Owner Type
Purchase Details
Closed on
Sep 15, 2021
Sold by
Redd Todd E
Bought by
Redd Melissa Marshall
Current Estimated Value
Home Financials for this Owner
Home Financials are based on the most recent Mortgage that was taken out on this home.
Original Mortgage
$217,250
Interest Rate
2.8%
Mortgage Type
New Conventional
Purchase Details
Closed on
Jun 22, 2016
Sold by
Redd Melissa M
Bought by
Redd Todd E
Purchase Details
Closed on
Jul 7, 2005
Sold by
Bartlett Lillian Palmer
Bought by
Redd Todd E and Redd Melissa M
Home Financials for this Owner
Home Financials are based on the most recent Mortgage that was taken out on this home.
Original Mortgage
$155,619
Interest Rate
5.46%
Mortgage Type
New Conventional
Purchase Details
Closed on
Jan 1, 1978
Sold by
Bartlett E W Est
Bought by
Bartlett Lillian P
Create a Home Valuation Report for This Property
The Home Valuation Report is an in-depth analysis detailing your home's value as well as a comparison with similar homes in the area
Home Values in the Area
Average Home Value in this Area
Purchase History
| Date | Buyer | Sale Price | Title Company |
|---|---|---|---|
| Redd Melissa Marshall | $215,000 | -- | |
| Redd Todd E | -- | -- | |
| Redd Todd E | $130,000 | -- | |
| Bartlett Lillian P | -- | -- |
Source: Public Records
Mortgage History
| Date | Status | Borrower | Loan Amount |
|---|---|---|---|
| Closed | Redd Melissa Marshall | $217,250 | |
| Previous Owner | Redd Todd E | $155,619 |
Source: Public Records
Tax History Compared to Growth
Tax History
| Year | Tax Paid | Tax Assessment Tax Assessment Total Assessment is a certain percentage of the fair market value that is determined by local assessors to be the total taxable value of land and additions on the property. | Land | Improvement |
|---|---|---|---|---|
| 2024 | $2,530 | $89,814 | $5,040 | $84,774 |
| 2023 | $2,711 | $90,868 | $7,920 | $82,948 |
| 2022 | $1,462 | $77,616 | $7,920 | $69,696 |
| 2021 | $1,205 | $64,209 | $7,920 | $56,289 |
| 2020 | $1,208 | $64,209 | $7,920 | $56,289 |
| 2019 | $1,085 | $56,717 | $7,920 | $48,797 |
| 2018 | $1,086 | $56,717 | $7,920 | $48,797 |
| 2017 | $1,097 | $57,045 | $7,920 | $49,125 |
| 2016 | $1,105 | $57,045 | $7,920 | $49,125 |
| 2015 | $1,360 | $69,030 | $7,920 | $61,110 |
| 2014 | $1,368 | $69,030 | $7,920 | $61,110 |
| 2013 | -- | $69,030 | $7,920 | $61,110 |
Source: Public Records
Map
Nearby Homes
- 511 Victory Dr
- 425 Jones Ave
- 508 Jones Ave
- 413 Jones Ave
- 506 Holly Dr
- 403 Shadrack St
- 810 Cedar Dr
- 640 Cherokee Dr
- 429 Mcintosh Dr
- 0000 Georgia 56
- 412 W 9th St
- 855 Academy Ave
- 816 Perry St
- 827 Railroad Ave
- 0 Railroad Ave
- 825 Railroad Ave
- 829 Railroad Ave
- 342 Spring Valley Rd
- 417 E 7th St
- 509 E 6th St
- 510 Forrest Dr
- 503 Victory Cir
- 506 Forest Dr
- 505 Forrest Dr
- 504 Victory Cir
- 512 Forrest Dr
- 507 Forest Dr
- 507 Forrest Dr
- 503 Forest Dr
- 502 Victory Cir
- 503 Forrest Dr
- 514 Forrest Dr
- 509 Forrest Dr
- 505 Victory Cir
- 506 Victory Dr
- 512 Victory Dr
- 511 Forrest Dr
- 508 Victory Dr
- 508 Victory Dr
- 514 Victory Dr