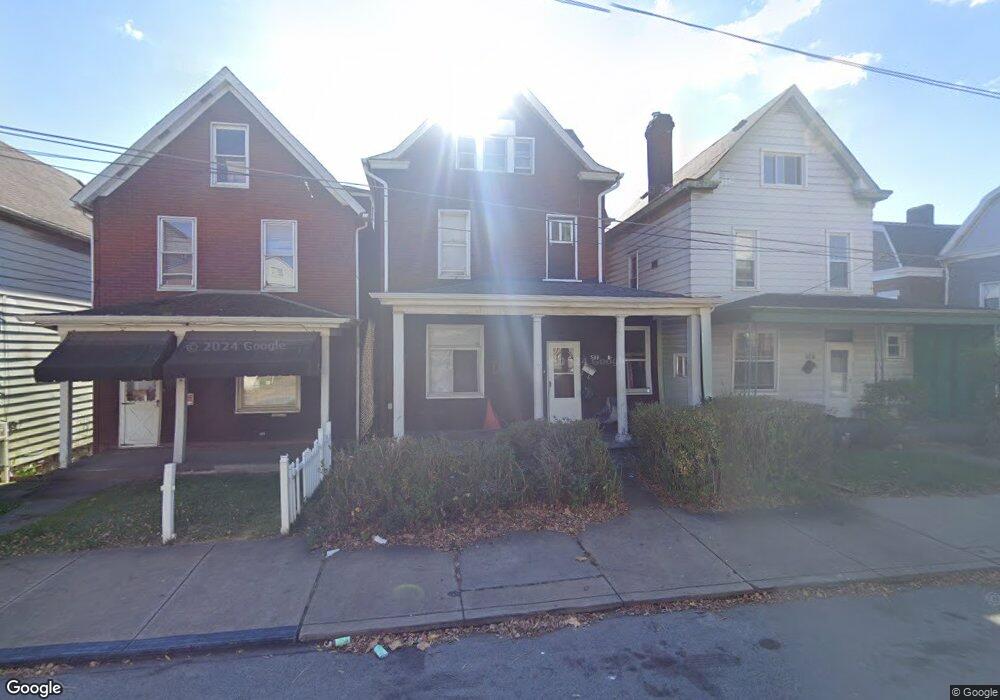
508 Franklin St East Pittsburgh, PA 15112
Estimated Value: $96,000 - $140,000
3
Beds
1
Bath
1,148
Sq Ft
$99/Sq Ft
Est. Value
About This Home
This home is located at 508 Franklin St, East Pittsburgh, PA 15112 and is currently estimated at $113,333, approximately $98 per square foot. 508 Franklin St is a home located in Allegheny County with nearby schools including Woodland Hills Senior High School, Braddock Hills High School, and Propel Cs-East.
Ownership History
Date
Name
Owned For
Owner Type
Purchase Details
Closed on
Jun 4, 2008
Sold by
Foreclosure Depot
Bought by
Campbell Jeffrey D
Current Estimated Value
Home Financials for this Owner
Home Financials are based on the most recent Mortgage that was taken out on this home.
Original Mortgage
$146,082
Outstanding Balance
$93,980
Interest Rate
6.1%
Mortgage Type
New Conventional
Estimated Equity
$19,353
Purchase Details
Closed on
Mar 19, 2008
Sold by
Citimortgage Inc
Bought by
Foreclosure Depot L L C
Purchase Details
Closed on
Oct 1, 2007
Sold by
Towns Denise
Bought by
Citimortgage Inc
Create a Home Valuation Report for This Property
The Home Valuation Report is an in-depth analysis detailing your home's value as well as a comparison with similar homes in the area
Home Values in the Area
Average Home Value in this Area
Purchase History
| Date | Buyer | Sale Price | Title Company |
|---|---|---|---|
| Campbell Jeffrey D | $15,100 | -- | |
| Foreclosure Depot L L C | $9,000 | -- | |
| Citimortgage Inc | $1,455 | -- |
Source: Public Records
Mortgage History
| Date | Status | Borrower | Loan Amount |
|---|---|---|---|
| Open | Campbell Jeffrey D | $146,082 |
Source: Public Records
Tax History Compared to Growth
Tax History
| Year | Tax Paid | Tax Assessment Tax Assessment Total Assessment is a certain percentage of the fair market value that is determined by local assessors to be the total taxable value of land and additions on the property. | Land | Improvement |
|---|---|---|---|---|
| 2025 | $1,541 | $34,500 | $3,000 | $31,500 |
| 2024 | $1,541 | $34,500 | $3,000 | $31,500 |
| 2023 | $1,559 | $34,500 | $3,000 | $31,500 |
| 2022 | $1,559 | $34,500 | $3,000 | $31,500 |
| 2021 | $1,419 | $34,500 | $3,000 | $31,500 |
| 2020 | $1,528 | $34,500 | $3,000 | $31,500 |
| 2019 | $1,502 | $34,500 | $3,000 | $31,500 |
| 2018 | $163 | $34,500 | $3,000 | $31,500 |
| 2017 | $1,502 | $34,500 | $3,000 | $31,500 |
| 2016 | $163 | $34,500 | $3,000 | $31,500 |
| 2015 | $163 | $34,500 | $3,000 | $31,500 |
| 2014 | $1,407 | $34,500 | $3,000 | $31,500 |
Source: Public Records
Map
Nearby Homes