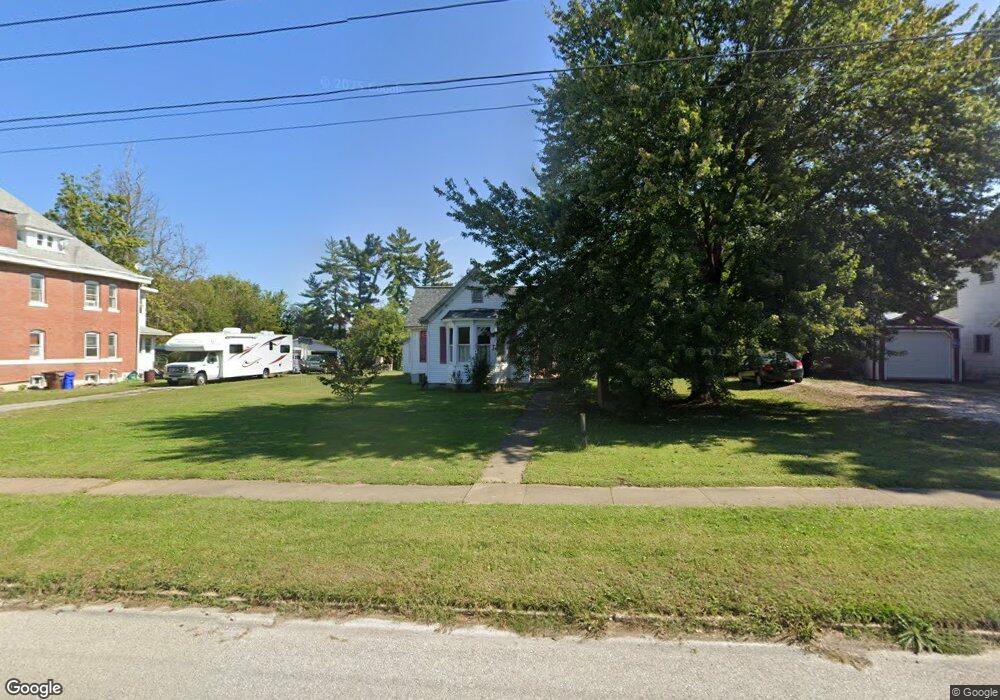
508 N 5th St Elsberry, MO 63343
Estimated Value: $151,700 - $166,000
3
Beds
1
Bath
1,414
Sq Ft
$114/Sq Ft
Est. Value
About This Home
This home is located at 508 N 5th St, Elsberry, MO 63343 and is currently estimated at $160,925, approximately $113 per square foot. 508 N 5th St is a home located in Lincoln County with nearby schools including Clarence Cannon Elementary School, Ida Cannon Middle School, and Elsberry High School.
Ownership History
Date
Name
Owned For
Owner Type
Purchase Details
Closed on
Aug 8, 2013
Sold by
Providence Bank
Bought by
Keeven Neil and Keeven Gerald D
Current Estimated Value
Home Financials for this Owner
Home Financials are based on the most recent Mortgage that was taken out on this home.
Original Mortgage
$18,400
Interest Rate
4.34%
Mortgage Type
New Conventional
Purchase Details
Closed on
Jul 28, 2006
Sold by
Leckbee David L and Leckbee Tami J
Bought by
Berroa Jose M and Berroa Barbara M
Create a Home Valuation Report for This Property
The Home Valuation Report is an in-depth analysis detailing your home's value as well as a comparison with similar homes in the area
Home Values in the Area
Average Home Value in this Area
Purchase History
| Date | Buyer | Sale Price | Title Company |
|---|---|---|---|
| Keeven Neil | -- | Meyer Title Company | |
| Berroa Jose M | -- | Meyer Title Company |
Source: Public Records
Mortgage History
| Date | Status | Borrower | Loan Amount |
|---|---|---|---|
| Closed | Keeven Neil | $18,400 |
Source: Public Records
Tax History Compared to Growth
Tax History
| Year | Tax Paid | Tax Assessment Tax Assessment Total Assessment is a certain percentage of the fair market value that is determined by local assessors to be the total taxable value of land and additions on the property. | Land | Improvement |
|---|---|---|---|---|
| 2025 | $631 | $10,956 | $559 | $10,397 |
| 2024 | $631 | $10,195 | $399 | $9,796 |
| 2023 | $629 | $10,195 | $399 | $9,796 |
| 2022 | $582 | $9,481 | $399 | $9,082 |
| 2021 | $585 | $49,900 | $0 | $0 |
| 2020 | $499 | $43,050 | $0 | $0 |
| 2019 | $499 | $43,050 | $0 | $0 |
| 2018 | $505 | $8,180 | $0 | $0 |
| 2017 | $506 | $8,180 | $0 | $0 |
| 2016 | $462 | $7,288 | $0 | $0 |
| 2015 | $462 | $7,288 | $0 | $0 |
| 2014 | $465 | $7,294 | $0 | $0 |
| 2013 | -- | $7,294 | $0 | $0 |
Source: Public Records
Map
Nearby Homes