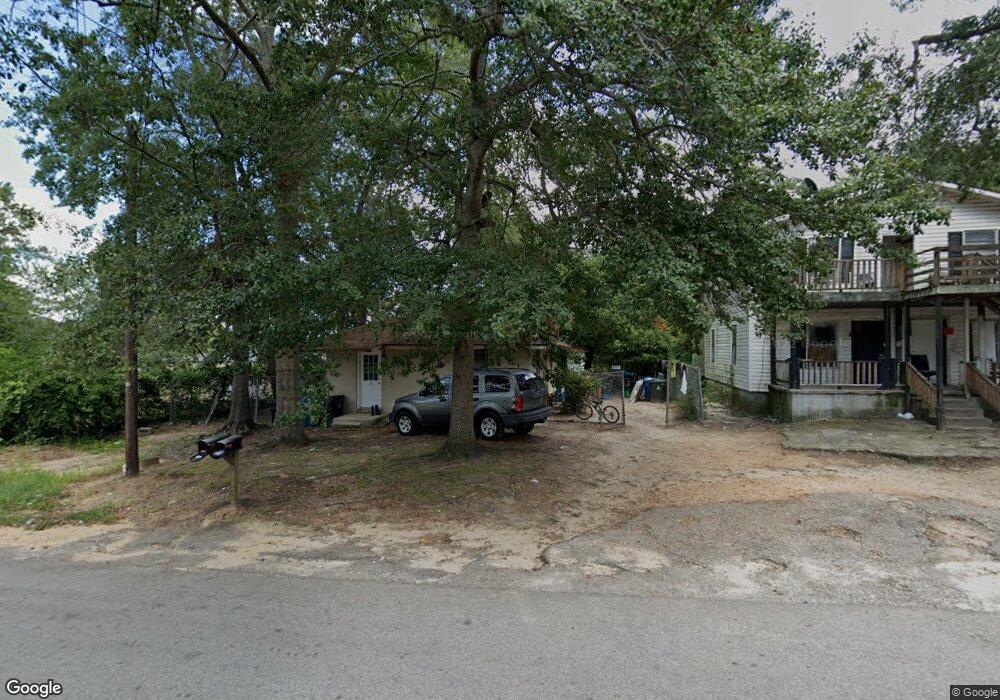
508 N Line St West Columbia, SC 29169
Estimated Value: $143,000 - $174,000
4
Beds
2
Baths
1,375
Sq Ft
$110/Sq Ft
Est. Value
About This Home
This home is located at 508 N Line St, West Columbia, SC 29169 and is currently estimated at $151,937, approximately $110 per square foot. 508 N Line St is a home located in Lexington County with nearby schools including Saluda River Academy For The Arts, Northside Middle, and Brookland-Cayce High School.
Ownership History
Date
Name
Owned For
Owner Type
Purchase Details
Closed on
Nov 30, 2009
Sold by
Branch Stanley
Bought by
Chapman Yusef L
Current Estimated Value
Home Financials for this Owner
Home Financials are based on the most recent Mortgage that was taken out on this home.
Original Mortgage
$57,120
Outstanding Balance
$37,333
Interest Rate
4.94%
Mortgage Type
Future Advance Clause Open End Mortgage
Estimated Equity
$114,604
Purchase Details
Closed on
Nov 18, 2009
Sold by
Branch Frances
Bought by
Branch Stanley
Home Financials for this Owner
Home Financials are based on the most recent Mortgage that was taken out on this home.
Original Mortgage
$57,120
Outstanding Balance
$37,333
Interest Rate
4.94%
Mortgage Type
Future Advance Clause Open End Mortgage
Estimated Equity
$114,604
Purchase Details
Closed on
Apr 10, 2002
Sold by
Brown Norma G
Bought by
Branch Stanley
Create a Home Valuation Report for This Property
The Home Valuation Report is an in-depth analysis detailing your home's value as well as a comparison with similar homes in the area
Home Values in the Area
Average Home Value in this Area
Purchase History
| Date | Buyer | Sale Price | Title Company |
|---|---|---|---|
| Chapman Yusef L | $71,400 | -- | |
| Branch Stanley | -- | -- | |
| Branch Stanley | $57,200 | -- |
Source: Public Records
Mortgage History
| Date | Status | Borrower | Loan Amount |
|---|---|---|---|
| Open | Chapman Yusef L | $57,120 | |
| Closed | Branch Stanley | $57,120 |
Source: Public Records
Tax History Compared to Growth
Tax History
| Year | Tax Paid | Tax Assessment Tax Assessment Total Assessment is a certain percentage of the fair market value that is determined by local assessors to be the total taxable value of land and additions on the property. | Land | Improvement |
|---|---|---|---|---|
| 2024 | $1,966 | $4,561 | $923 | $3,638 |
| 2023 | $1,800 | $4,561 | $923 | $3,638 |
| 2022 | $1,705 | $4,561 | $923 | $3,638 |
| 2020 | $1,616 | $4,561 | $923 | $3,638 |
| 2019 | $1,422 | $3,966 | $900 | $3,066 |
| 2018 | $1,410 | $3,966 | $900 | $3,066 |
| 2017 | $1,384 | $3,966 | $900 | $3,066 |
| 2016 | $1,400 | $3,965 | $900 | $3,065 |
| 2014 | $1,287 | $4,199 | $900 | $3,299 |
| 2013 | -- | $4,200 | $900 | $3,300 |
Source: Public Records
Map
Nearby Homes
- 502A Koon St
- 706 Violet St
- 816 Fontanna Ave
- 918 N Lucas St
- 103 Chicorana Rd
- 638 Carrington Dr
- 916 Mohegan Trail
- 1028 Augusta St
- 1235 Jensen St
- 3 Lynnwood Rd
- 1344 Gilmore St
- 908 B Ave
- 324 N Parson St
- 121 Edgewater Ln
- 225 Edgewater Ln
- 633 Edgewater Ln
- 634 Edgewater Ln
- 941 Mohegan Trail
- Tract 1 Hallelujah Rd
- 515 Center St